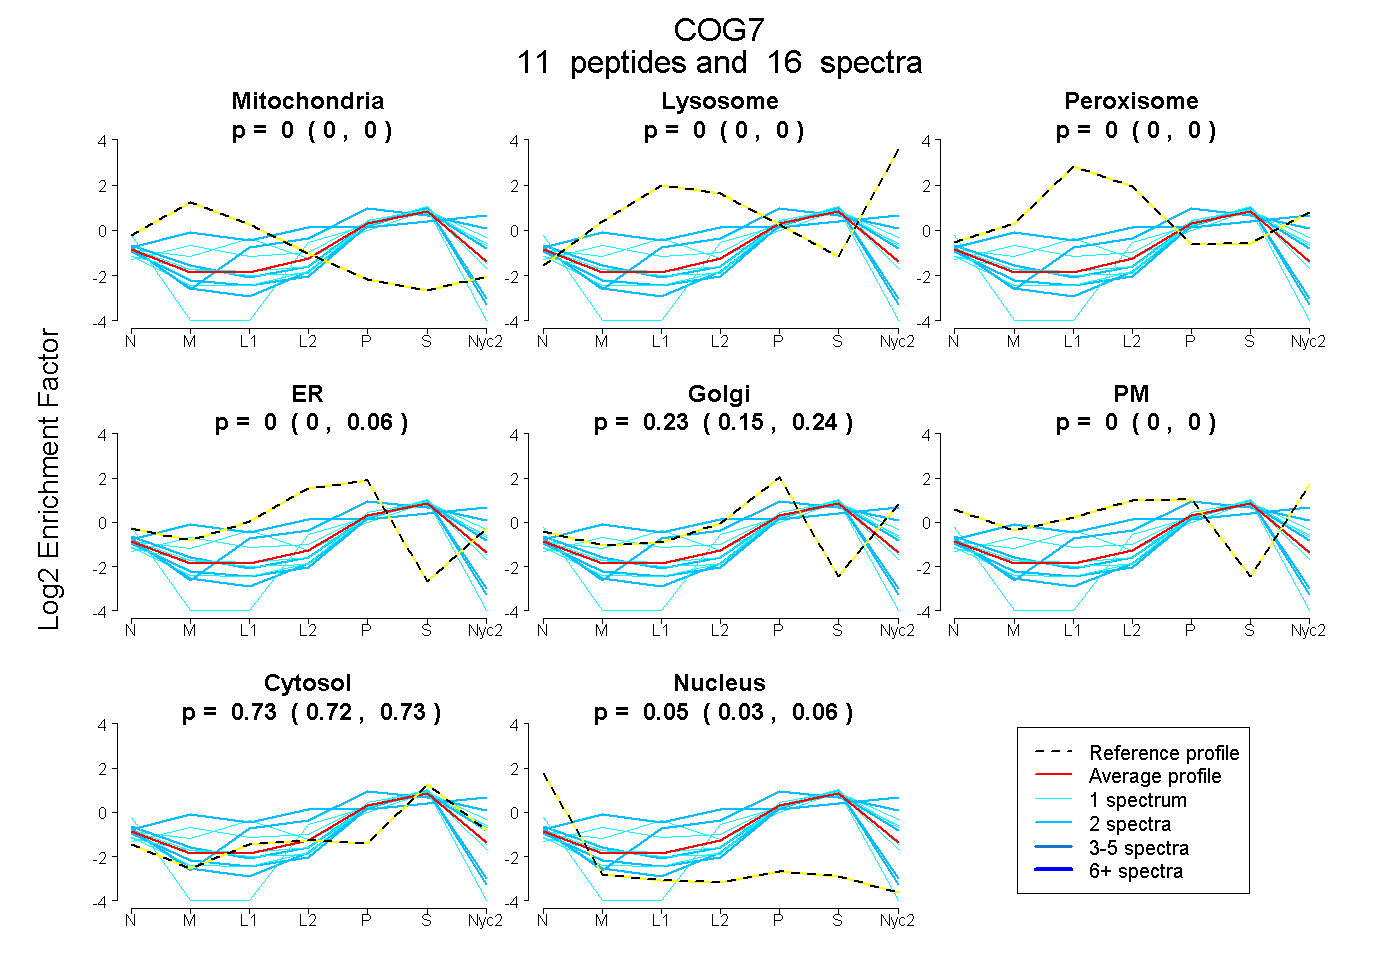
 11
11peptides
spectra
0.000 | 0.000
0.000 | 0.000
0.000 | 0.000
0.000 | 0.057
0.147 | 0.243
0.000 | 0.000
0.716 | 0.734
0.027 | 0.061
| Plot | Mito | Lyso | Perox | ER | Golgi | PM | Cytosol | Nucleus | |||||
| Expt A |
11 peptides |
16 spectra |
|
0.000 0.000 | 0.000 |
0.000 0.000 | 0.000 |
0.000 0.000 | 0.000 |
0.000 0.000 | 0.057 |
0.229 0.147 | 0.243 |
0.000 0.000 | 0.000 |
0.725 0.716 | 0.734 |
0.046 0.027 | 0.061 |
| 1 spectrum, VFTEIDR | 0.000 | 0.000 | 0.000 | 0.000 | 0.243 | 0.000 | 0.757 | 0.000 | ||
| 1 spectrum, EQMILVK | 0.046 | 0.005 | 0.048 | 0.000 | 0.292 | 0.000 | 0.610 | 0.000 | ||
| 2 spectra, YVSHFTNALQSIR | 0.026 | 0.225 | 0.103 | 0.000 | 0.138 | 0.082 | 0.425 | 0.000 | ||
| 1 spectrum, QCGDFEQQLANR | 0.000 | 0.000 | 0.000 | 0.000 | 0.192 | 0.000 | 0.725 | 0.083 | ||
| 1 spectrum, LLEFYDTTAHFAK | 0.000 | 0.000 | 0.000 | 0.000 | 0.129 | 0.000 | 0.794 | 0.077 | ||
| 2 spectra, TLQNIATLLK | 0.000 | 0.032 | 0.000 | 0.064 | 0.321 | 0.000 | 0.583 | 0.000 | ||
| 2 spectra, LFGLASAAVDR | 0.000 | 0.000 | 0.000 | 0.000 | 0.259 | 0.000 | 0.697 | 0.044 | ||
| 1 spectrum, VQLLATWQELCQR | 0.000 | 0.000 | 0.000 | 0.000 | 0.000 | 0.000 | 0.646 | 0.354 | ||
| 2 spectra, GLEMALLPHLQDHNLVK | 0.000 | 0.000 | 0.000 | 0.000 | 0.013 | 0.000 | 0.744 | 0.244 | ||
| 1 spectrum, CVHLEALK | 0.004 | 0.000 | 0.164 | 0.000 | 0.191 | 0.000 | 0.642 | 0.000 | ||
| 2 spectra, IIATCGELLR | 0.000 | 0.000 | 0.000 | 0.022 | 0.000 | 0.000 | 0.739 | 0.239 |
| Plot | Mito | Lyso or Perox | ER | Golgi | PM | Cytosol | Nucleus | ||||||
| Expt B |
3 peptides |
5 spectra |
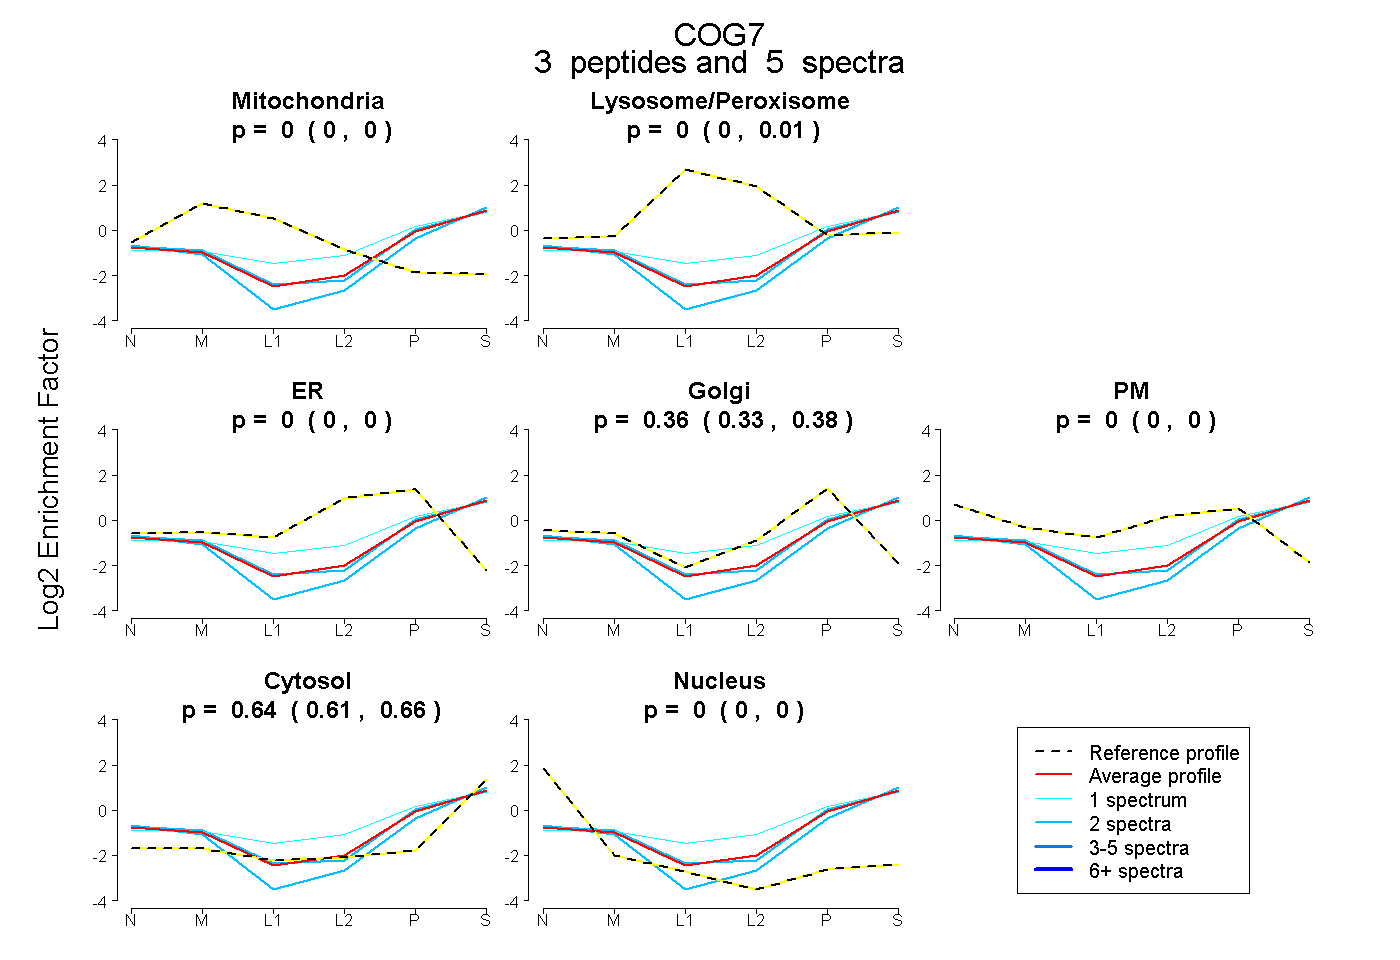 |
0.000 0.000 | 0.000 |
0.000 0.000 | 0.009 |
0.000 0.000 | 0.000 |
0.360 0.325 | 0.380 |
0.000 0.000 | 0.000 |
0.640 0.611 | 0.662 |
0.000 0.000 | 0.000 |
|||
| Plot | Lyso | Other | |||||||||||
| Expt C |
6 peptides |
13 spectra |
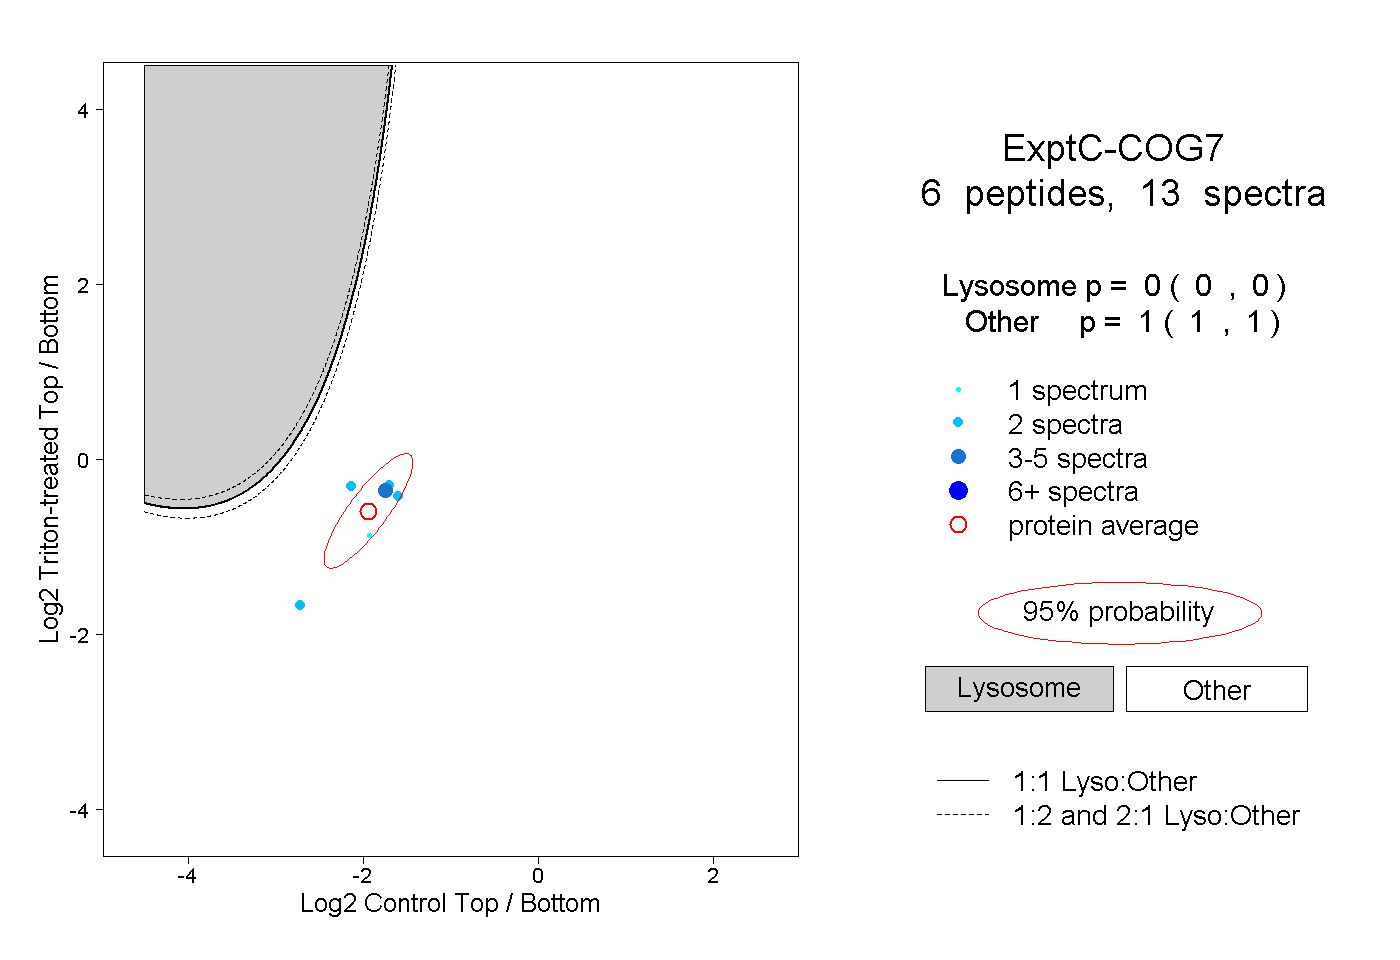 |
0.000 0.000 | 0.000 |
1.000 1.000 | 1.000 |