 6
6peptides
spectra
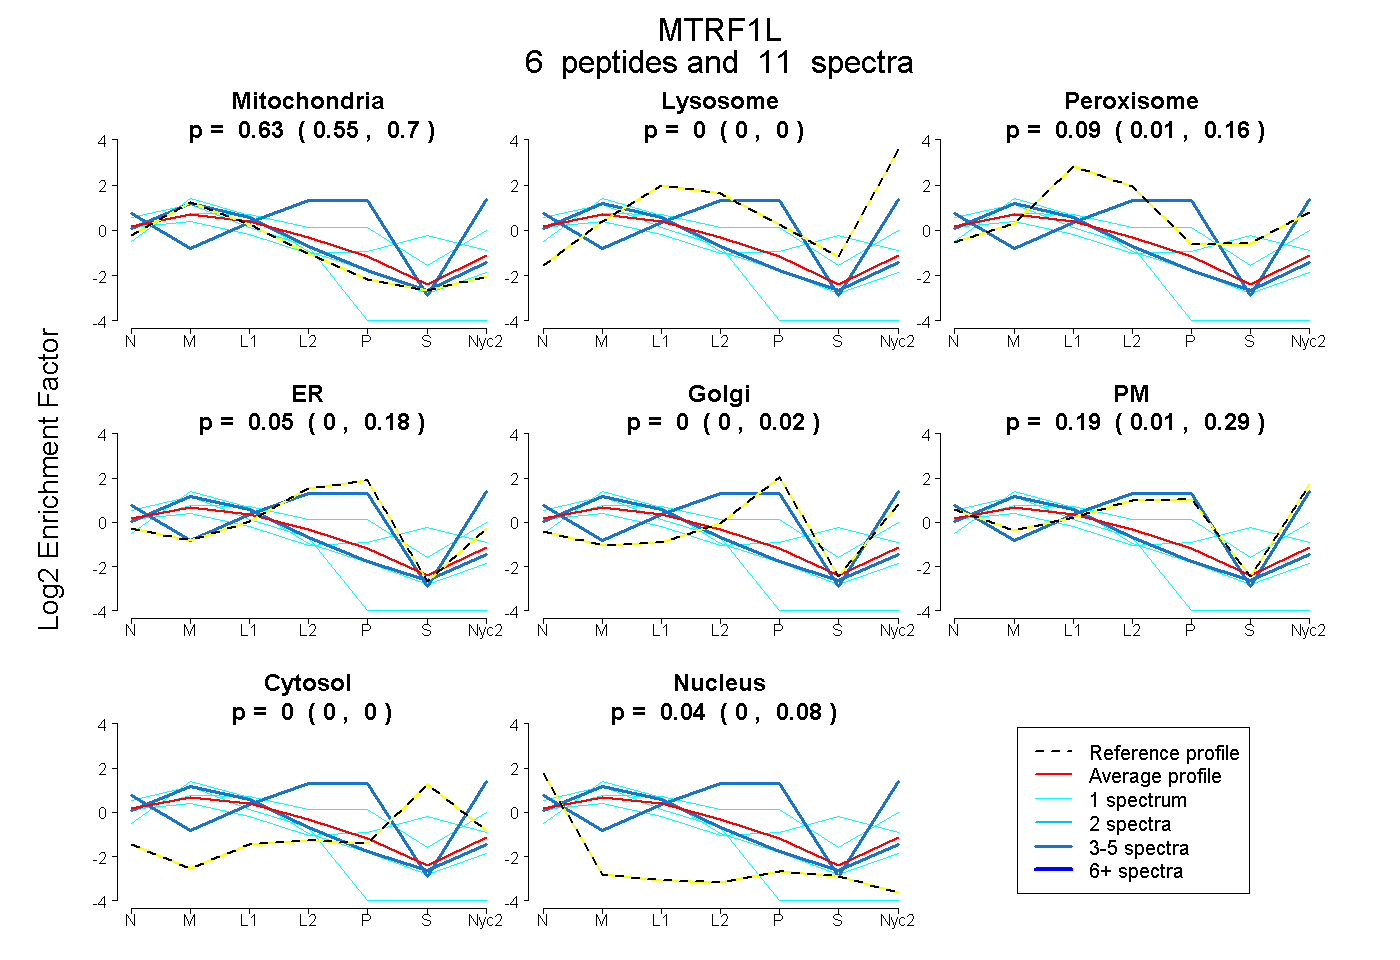
0.551 | 0.695
0.000 | 0.000
0.006 | 0.164
0.000 | 0.179
0.000 | 0.025
0.015 | 0.288
0.000 | 0.003
0.000 | 0.082
9peptides
spectra
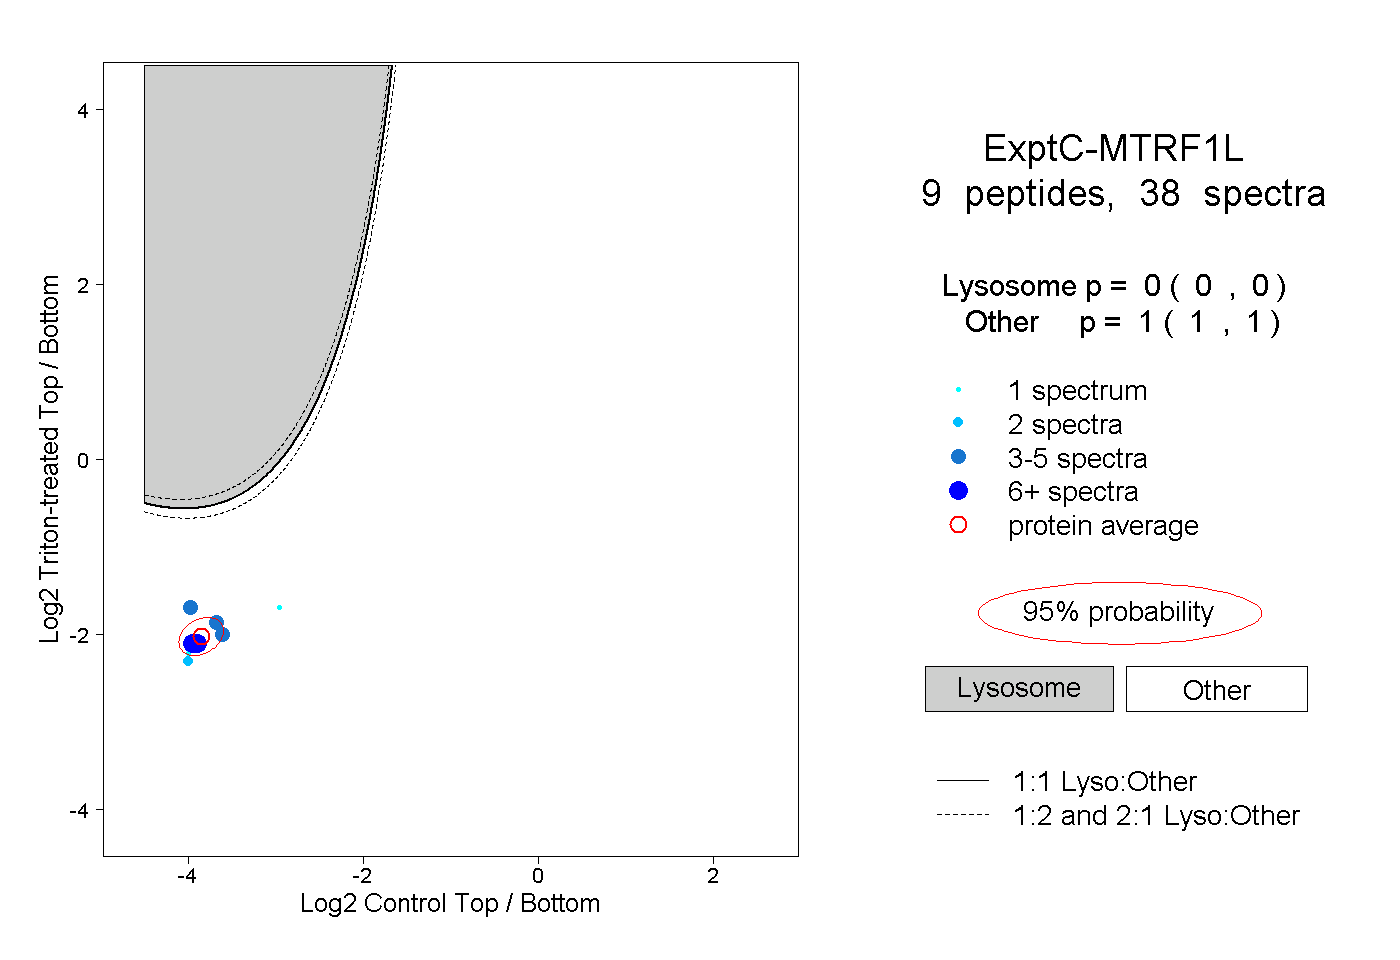
0.000 | 0.000
1.000 | 1.000
1peptide
spectrum
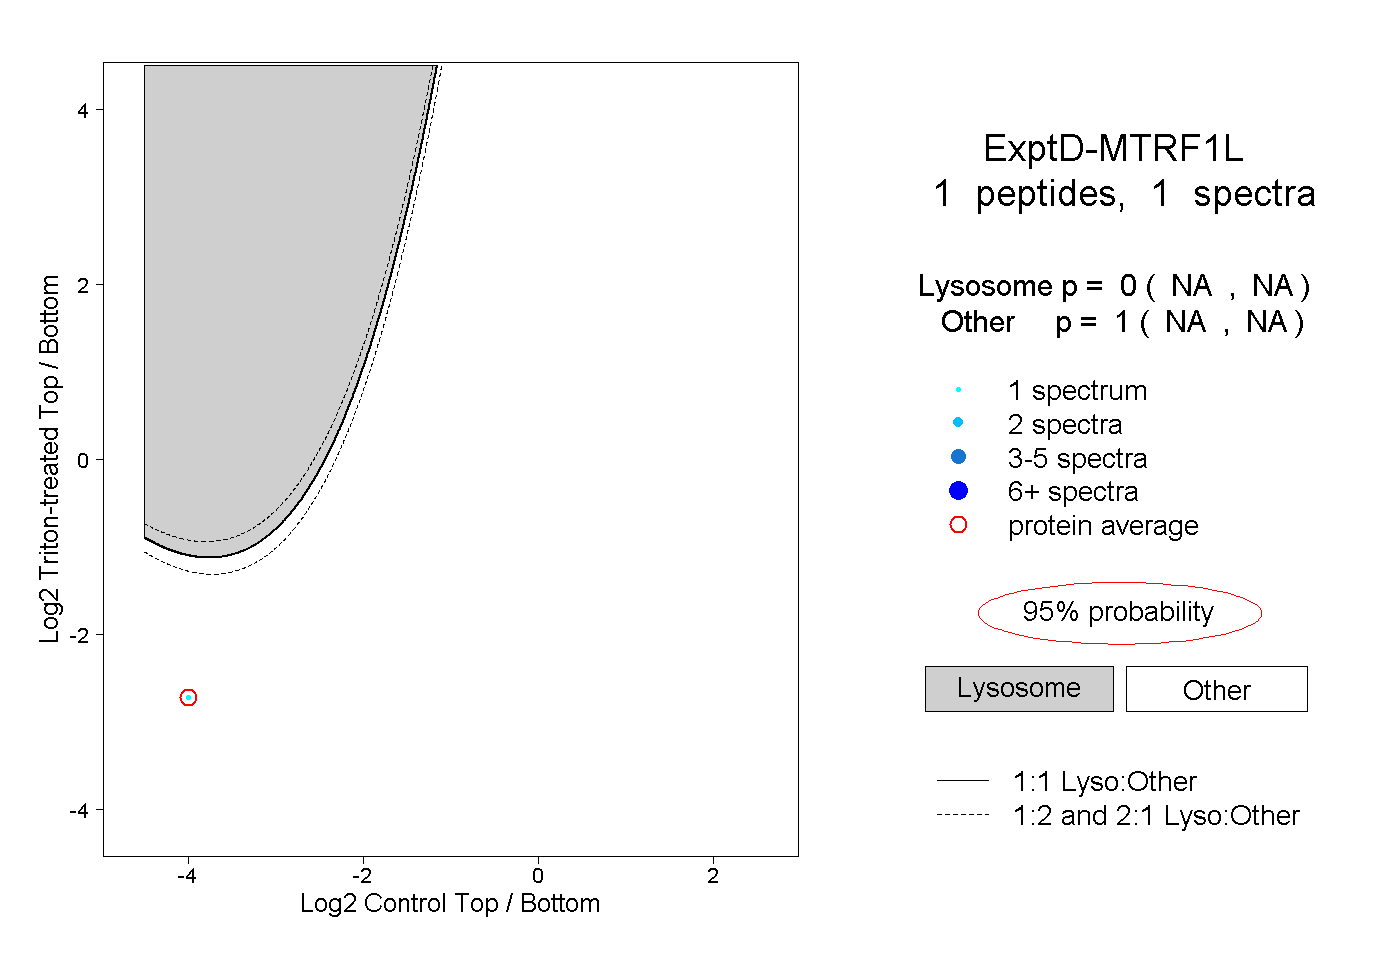
NA | NA
NA | NA