 6
6peptides
spectra
0.551 | 0.695
0.000 | 0.000
0.006 | 0.164
0.000 | 0.179
0.000 | 0.025
0.015 | 0.288
0.000 | 0.003
0.000 | 0.082
| Plot | Mito | Lyso | Perox | ER | Golgi | PM | Cytosol | Nucleus | |||||
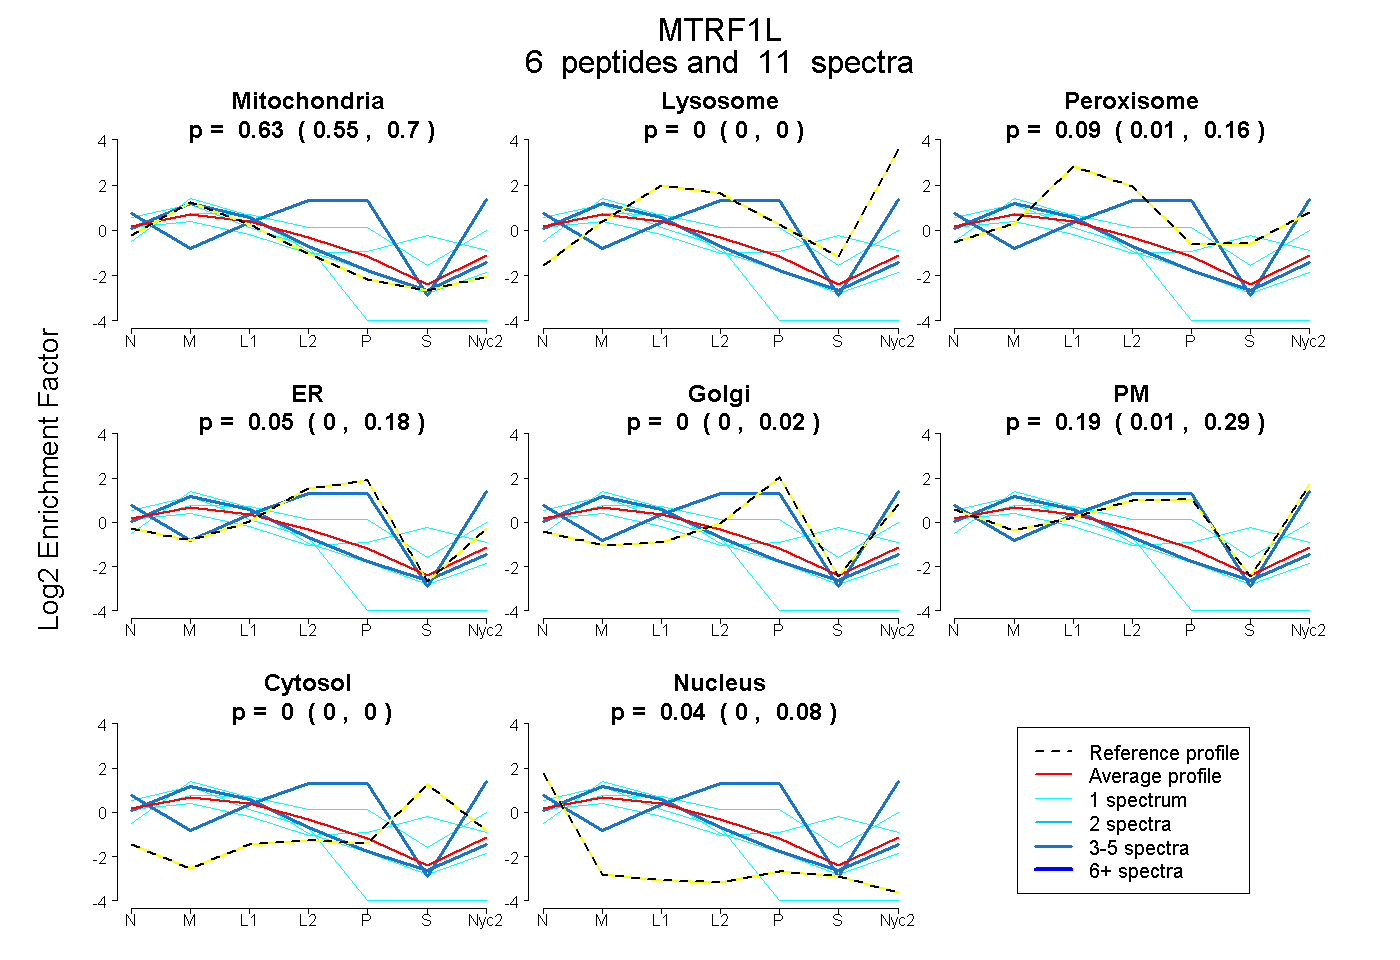
| Expt A |
6 peptides |
11 spectra |
|
0.631 0.551 | 0.695 |
0.000 0.000 | 0.000 |
0.089 0.006 | 0.164 |
0.052 0.000 | 0.179 |
0.000 0.000 | 0.025 |
0.189 0.015 | 0.288 |
0.000 0.000 | 0.003 |
0.039 0.000 | 0.082 |
| 1 spectrum, IVHLPTGIISECQQER | 0.325 | 0.000 | 0.284 | 0.000 | 0.222 | 0.168 | 0.000 | 0.000 | ||
| 1 spectrum, LVINPK | 0.431 | 0.000 | 0.095 | 0.000 | 0.000 | 0.119 | 0.355 | 0.000 | ||
| 1 spectrum, DYSDYESLVEMISR | 0.936 | 0.041 | 0.007 | 0.015 | 0.000 | 0.000 | 0.000 | 0.000 | ||
| 3 spectra, SGFLR | 0.000 | 0.000 | 0.000 | 0.191 | 0.000 | 0.809 | 0.000 | 0.000 | ||
| 1 spectrum, LAESEIALCQK | 0.848 | 0.000 | 0.000 | 0.000 | 0.000 | 0.000 | 0.000 | 0.152 | ||
| 4 spectra, MPPPSEELLAR | 0.843 | 0.000 | 0.055 | 0.000 | 0.000 | 0.102 | 0.000 | 0.000 |
| Plot | Lyso | Other | |||||||||||
| Expt C |
9 peptides |
38 spectra |
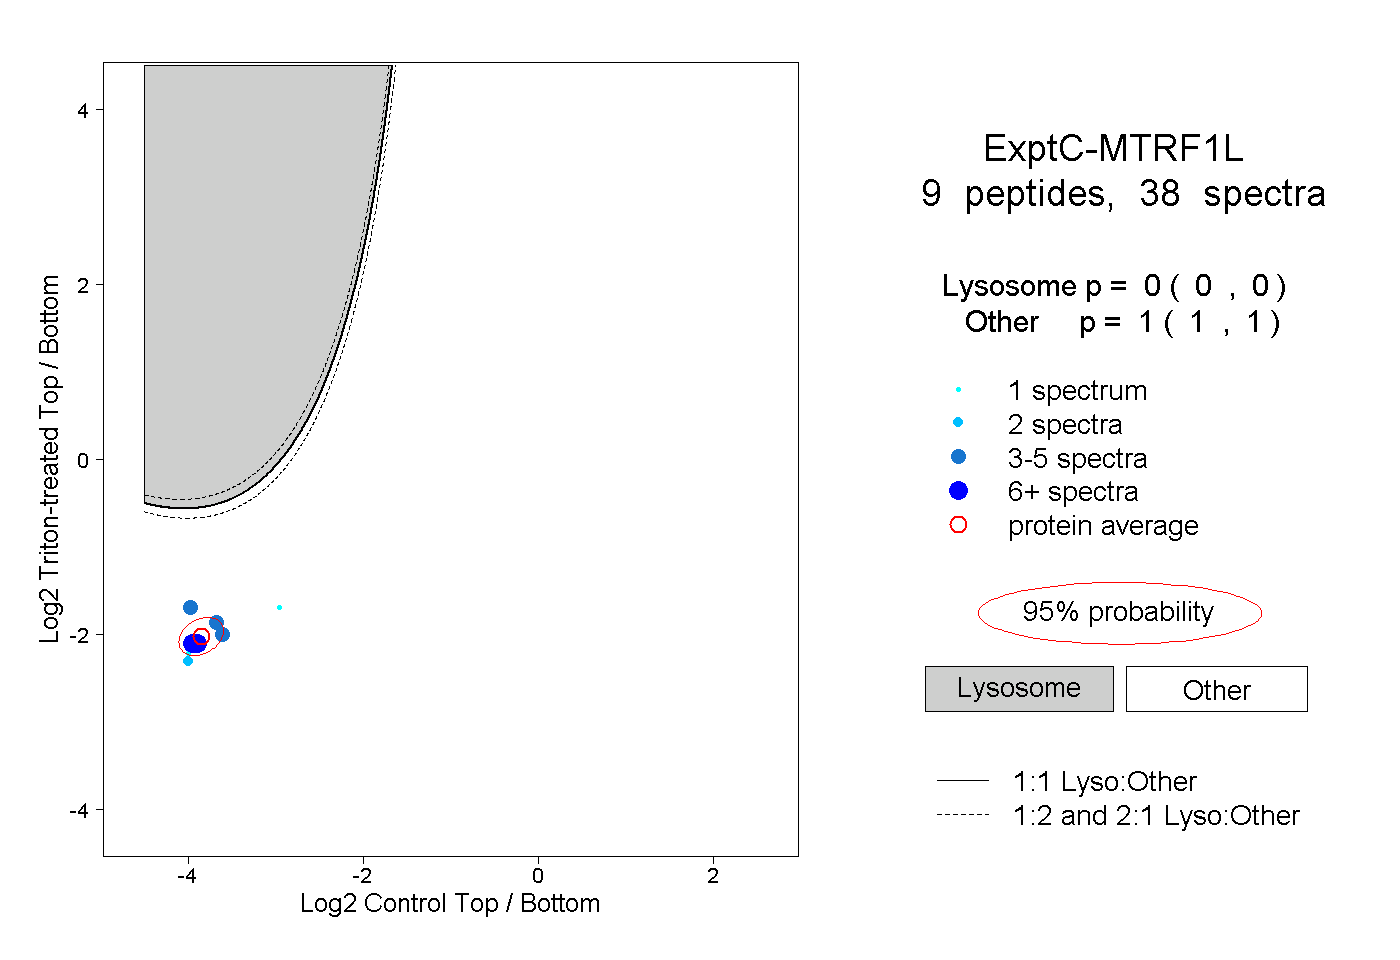 |
0.000 0.000 | 0.000 |
1.000 1.000 | 1.000 |
||||||||
| Plot | Lyso | Other | |||||||||||
| Expt D |
1 peptide |
1 spectrum |
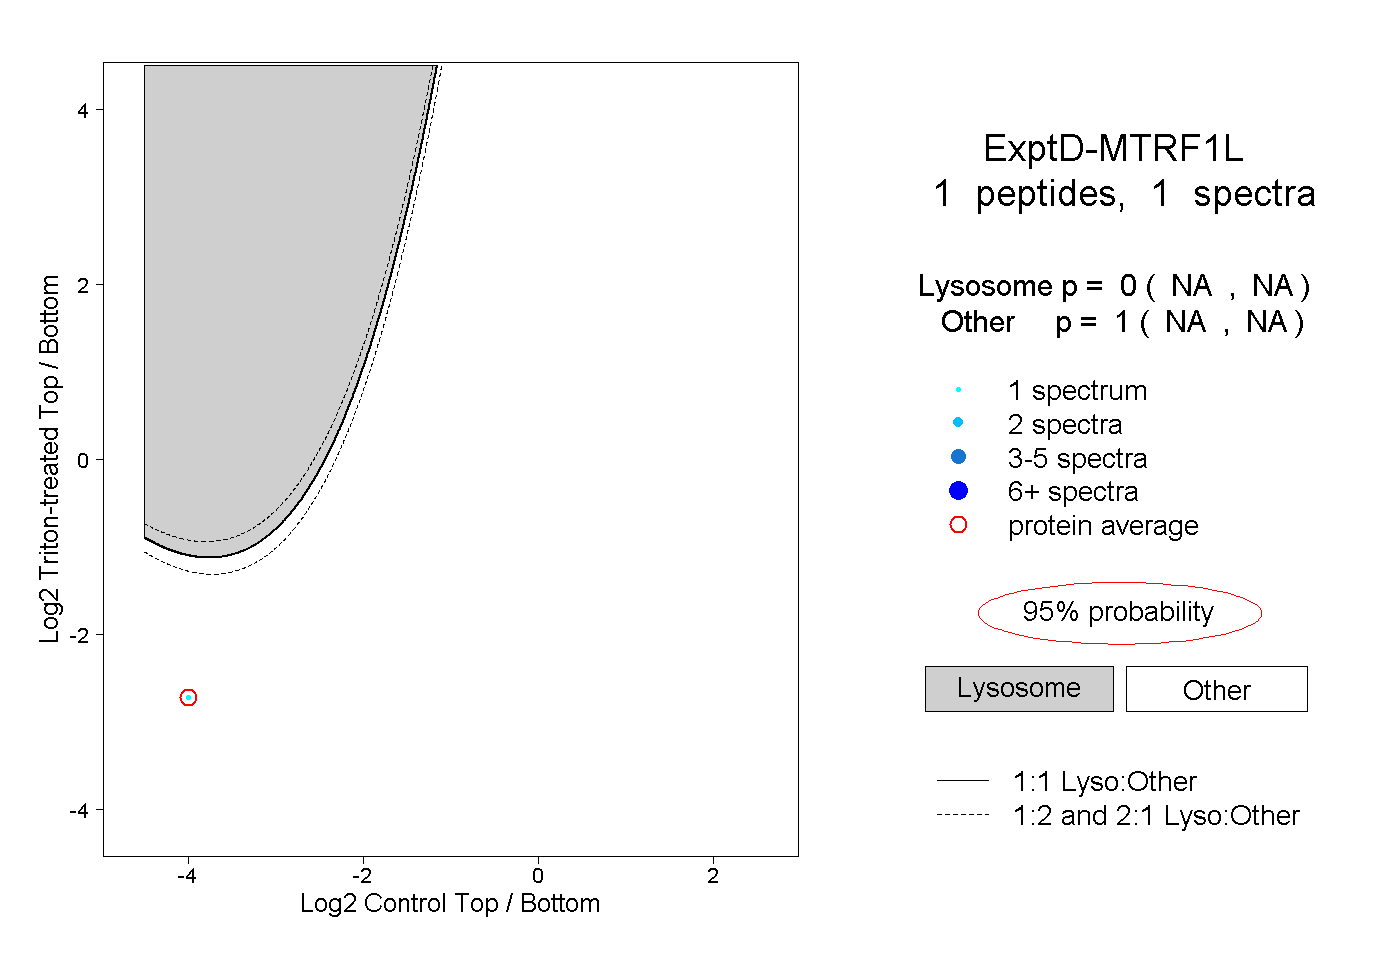 |
0.000 NA | NA |
1.000 NA | NA |