 8
8peptides
spectra
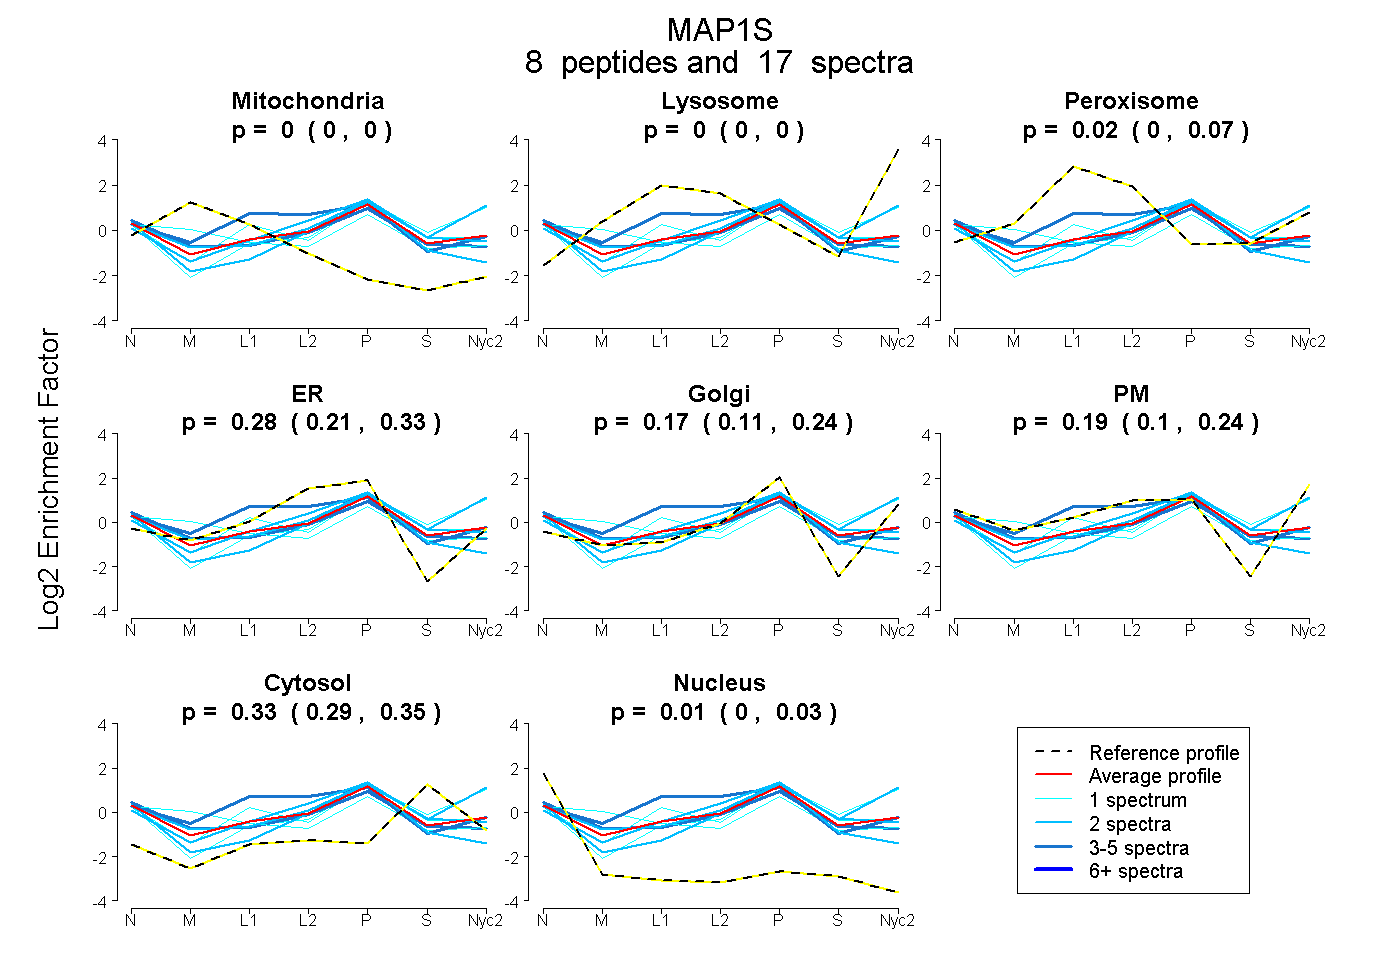
0.000 | 0.000
0.000 | 0.000
0.000 | 0.069
0.215 | 0.333
0.108 | 0.240
0.100 | 0.240
0.292 | 0.346
0.000 | 0.027
4peptides
spectra
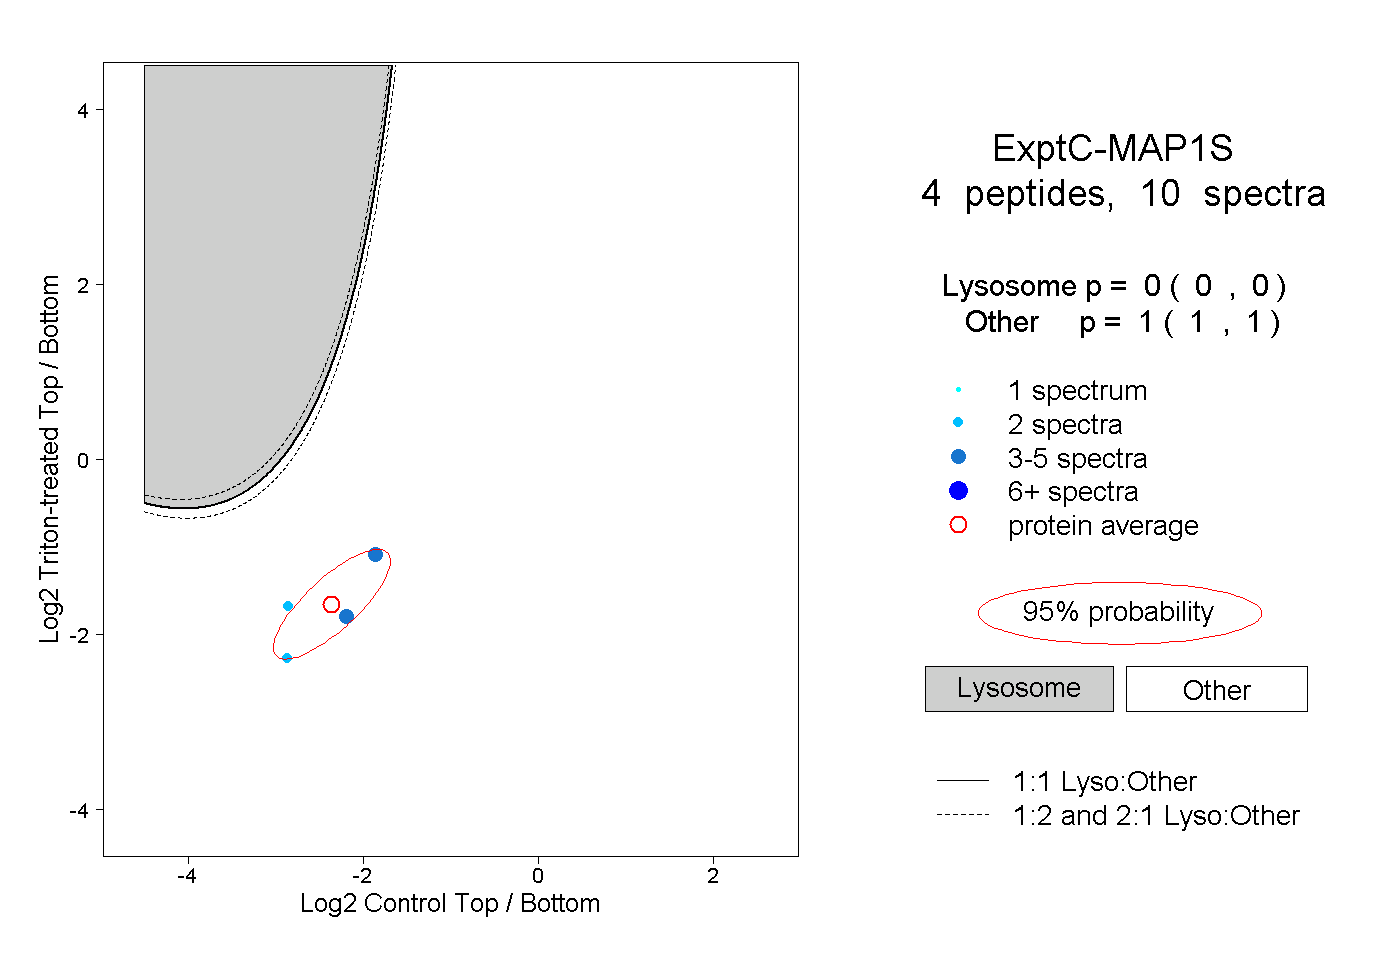
0.000 | 0.000
1.000 | 1.000
1peptide
spectra
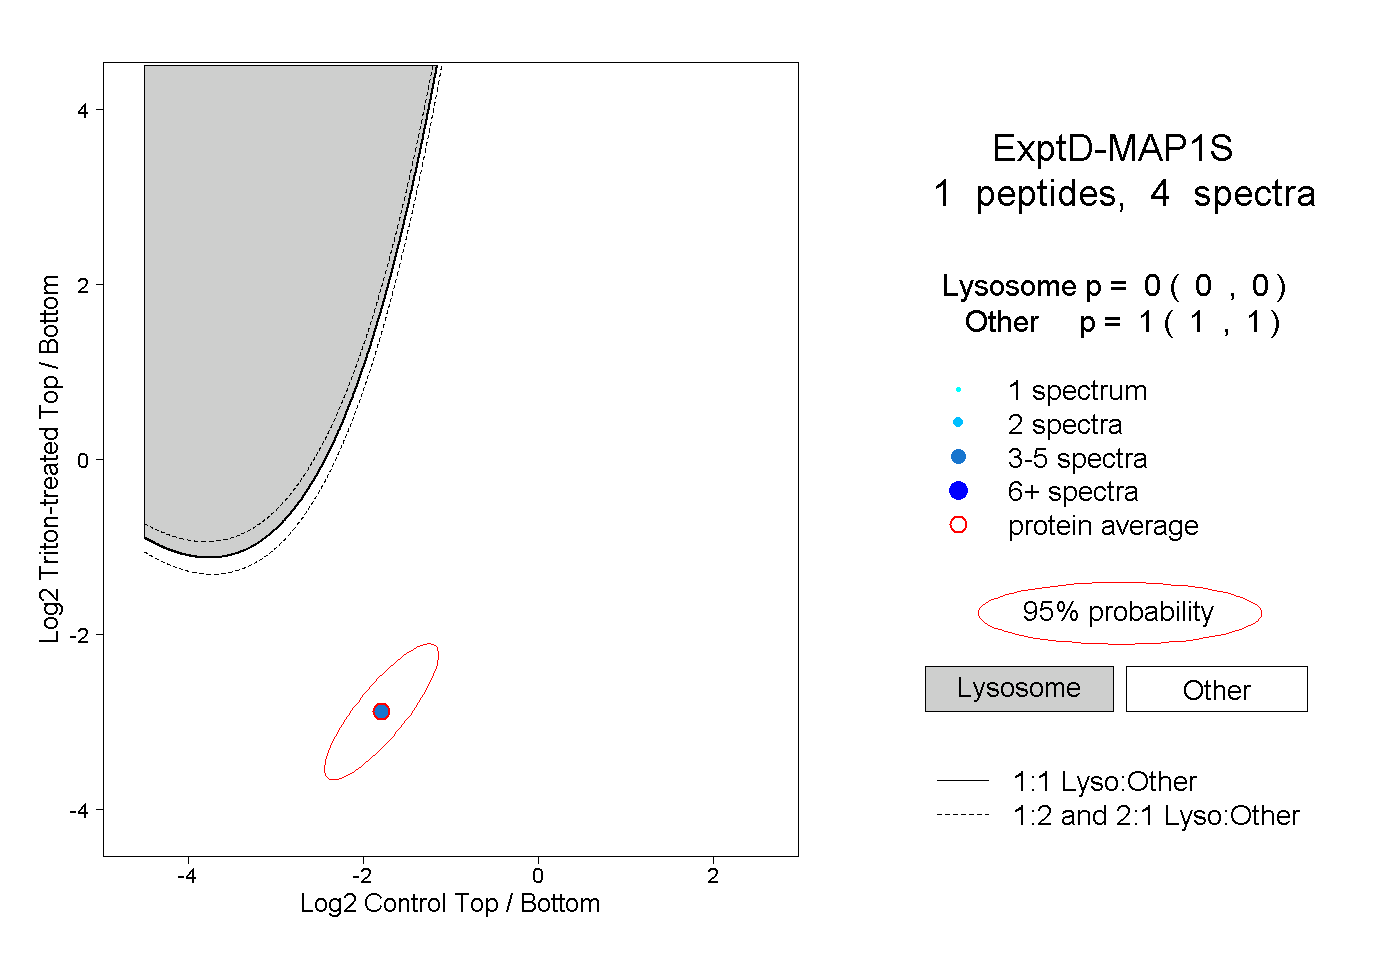
0.000 | 0.000
1.000 | 1.000