 8
8peptides
spectra
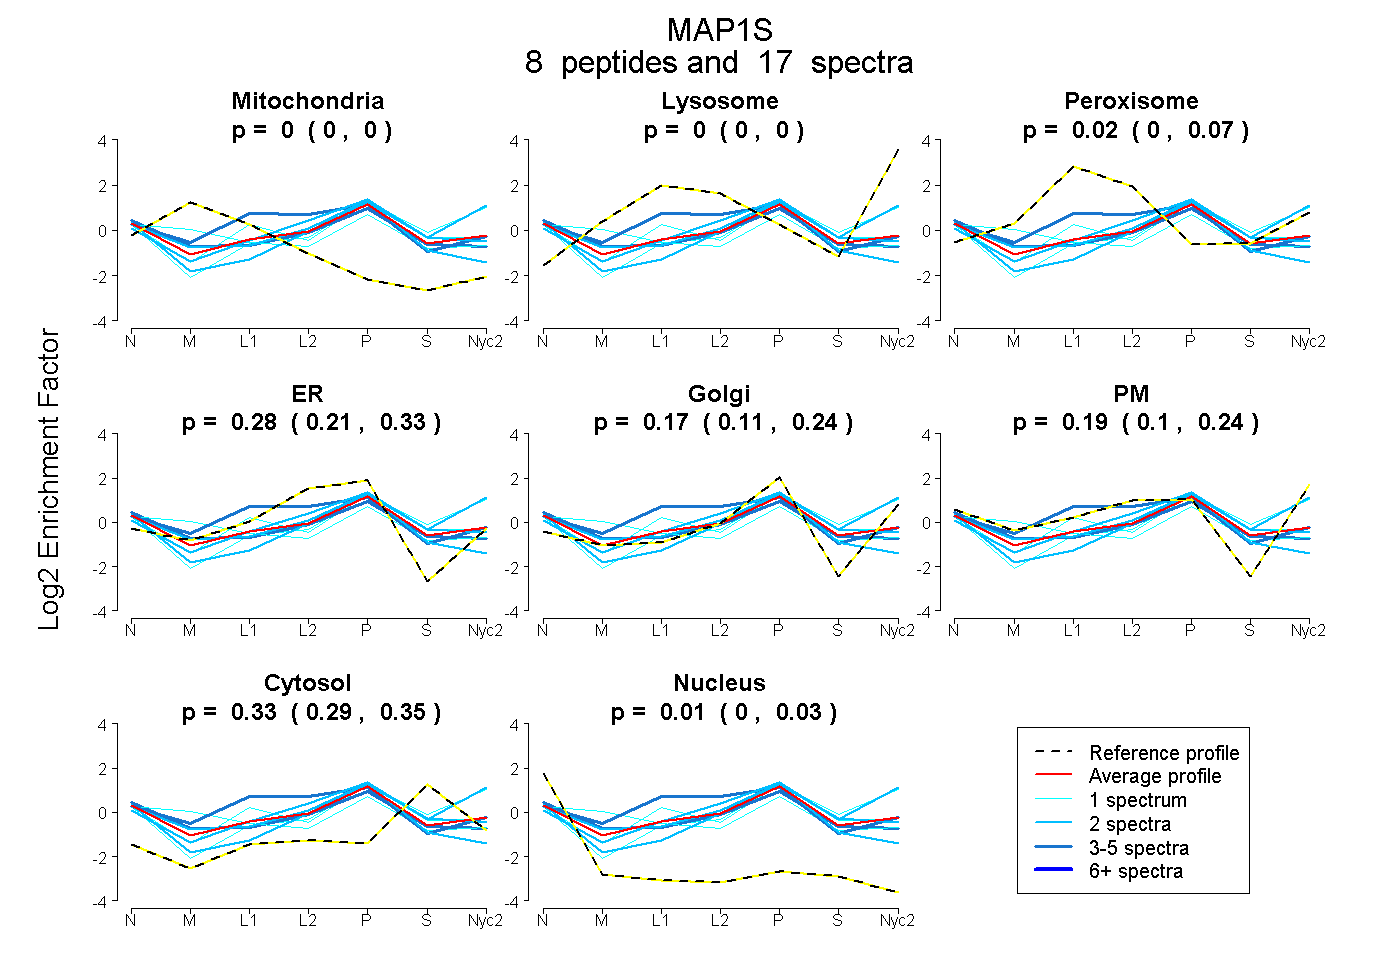
0.000 | 0.000
0.000 | 0.000
0.000 | 0.069
0.215 | 0.333
0.108 | 0.240
0.100 | 0.240
0.292 | 0.346
0.000 | 0.027
| Plot | Mito | Lyso | Perox | ER | Golgi | PM | Cytosol | Nucleus | |||||
| Expt A |
8 peptides |
17 spectra |
|
0.000 0.000 | 0.000 |
0.000 0.000 | 0.000 |
0.024 0.000 | 0.069 |
0.282 0.215 | 0.333 |
0.166 0.108 | 0.240 |
0.190 0.100 | 0.240 |
0.326 0.292 | 0.346 |
0.012 0.000 | 0.027 |
| 2 spectra, SLCDELR | 0.000 | 0.071 | 0.000 | 0.000 | 0.249 | 0.392 | 0.288 | 0.000 | ||
| 4 spectra, EAAAGPQGQHEER | 0.042 | 0.000 | 0.000 | 0.374 | 0.081 | 0.140 | 0.305 | 0.058 | ||
| 1 spectrum, APARPSSASAAPR | 0.000 | 0.000 | 0.000 | 0.000 | 0.310 | 0.310 | 0.380 | 0.000 | ||
| 1 spectrum, ANSQDSLASR | 0.000 | 0.000 | 0.183 | 0.094 | 0.414 | 0.000 | 0.281 | 0.027 | ||
| 2 spectra, SLGIVPLPLQR | 0.000 | 0.000 | 0.000 | 0.255 | 0.326 | 0.000 | 0.381 | 0.038 | ||
| 1 spectrum, GTVGATSR | 0.277 | 0.000 | 0.053 | 0.000 | 0.476 | 0.000 | 0.194 | 0.000 | ||
| 4 spectra, LQHLPCLR | 0.000 | 0.000 | 0.332 | 0.383 | 0.145 | 0.000 | 0.102 | 0.039 | ||
| 2 spectra, RPVVTTQDLEVPSR | 0.022 | 0.000 | 0.000 | 0.633 | 0.000 | 0.000 | 0.252 | 0.093 |
| Plot | Lyso | Other | |||||||||||
| Expt C |
4 peptides |
10 spectra |
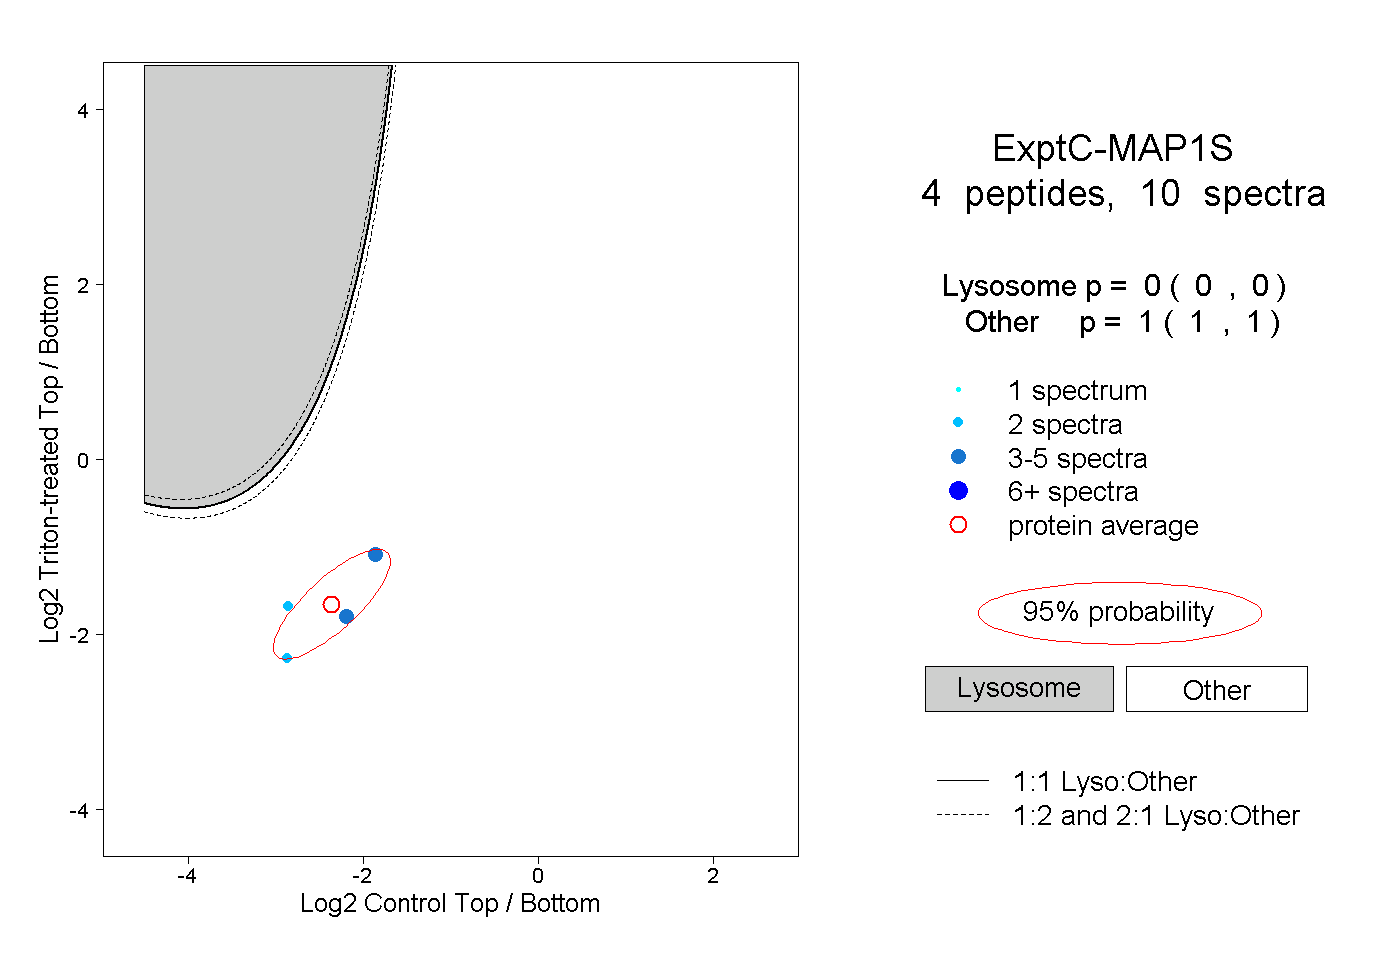 |
0.000 0.000 | 0.000 |
1.000 1.000 | 1.000 |
||||||||
| Plot | Lyso | Other | |||||||||||
| Expt D |
1 peptide |
4 spectra |
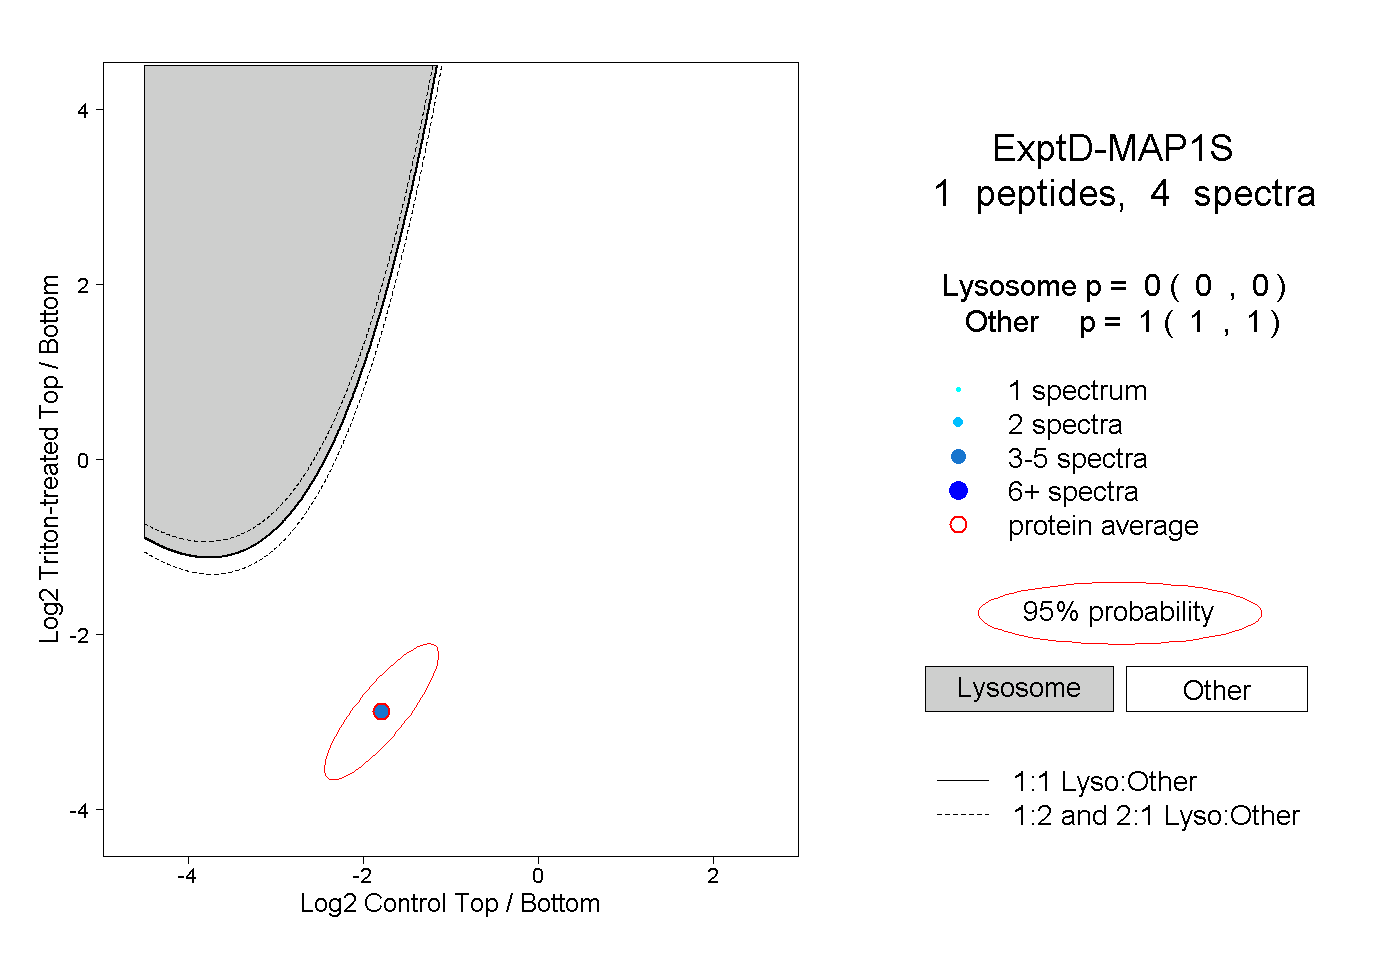 |
0.000 0.000 | 0.000 |
1.000 1.000 | 1.000 |