 12
12peptides
spectra
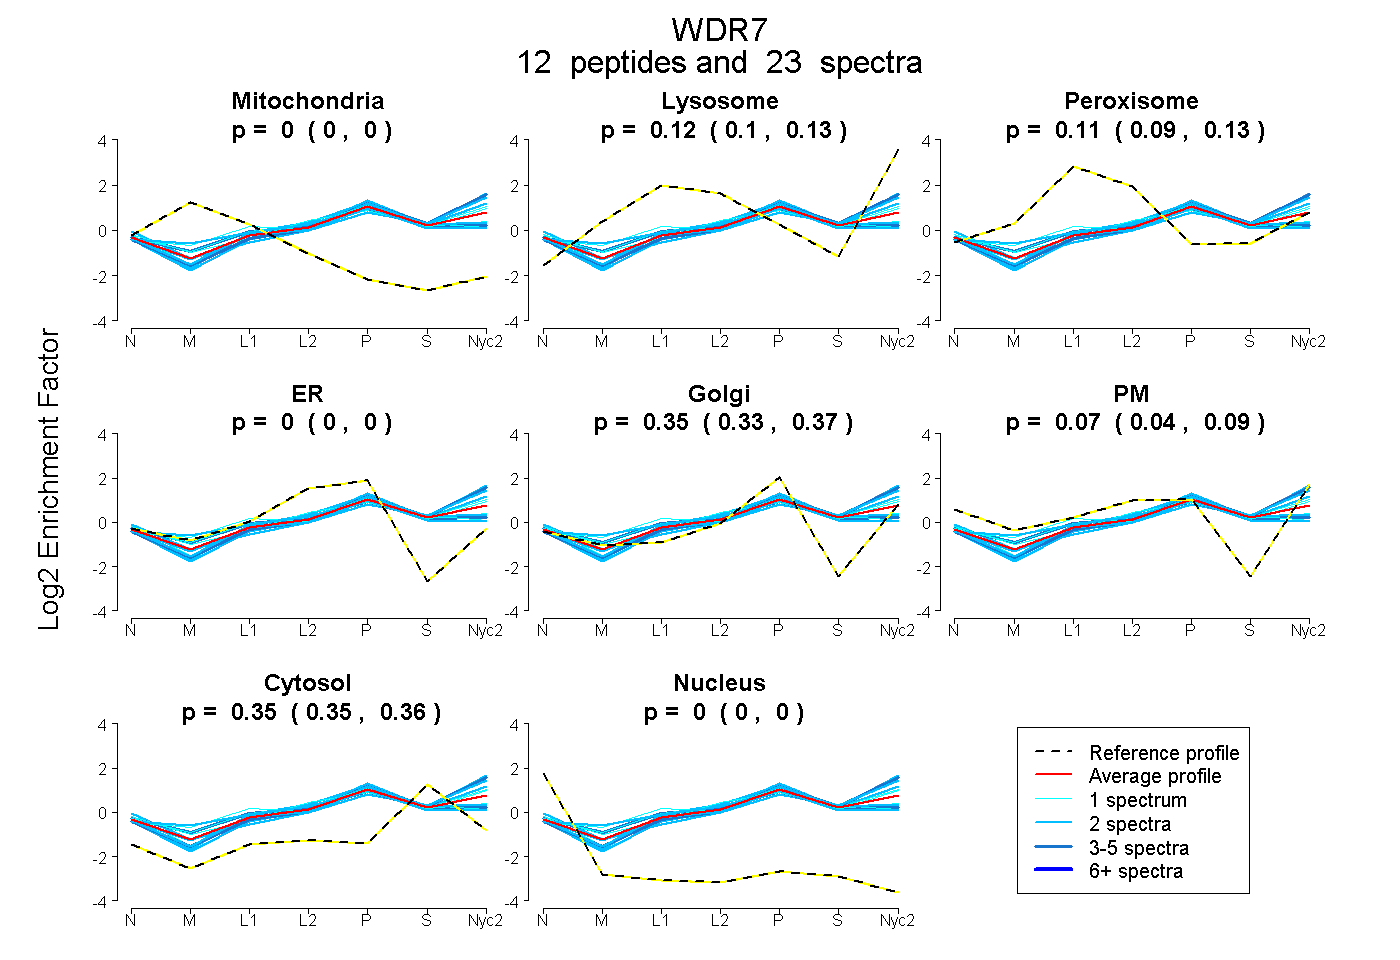
0.000 | 0.000
0.095 | 0.135
0.088 | 0.134
0.000 | 0.000
0.325 | 0.369
0.045 | 0.088
0.346 | 0.358
0.000 | 0.000
2peptides
spectra
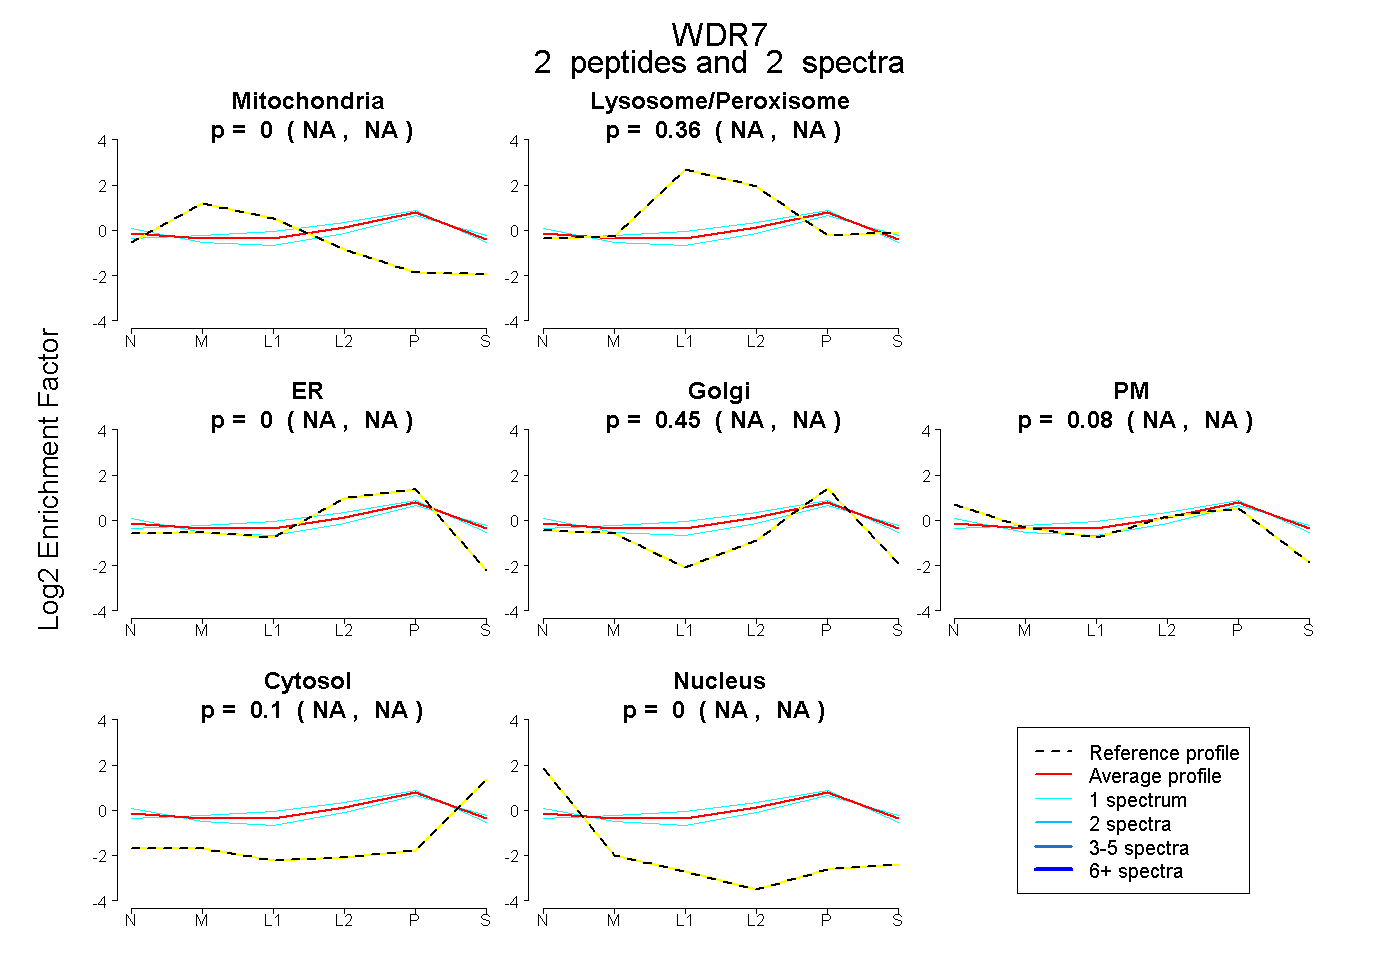
NA | NA
NA | NA
NA | NA
NA | NA
NA | NA
NA | NA
NA | NA
8peptides
spectra
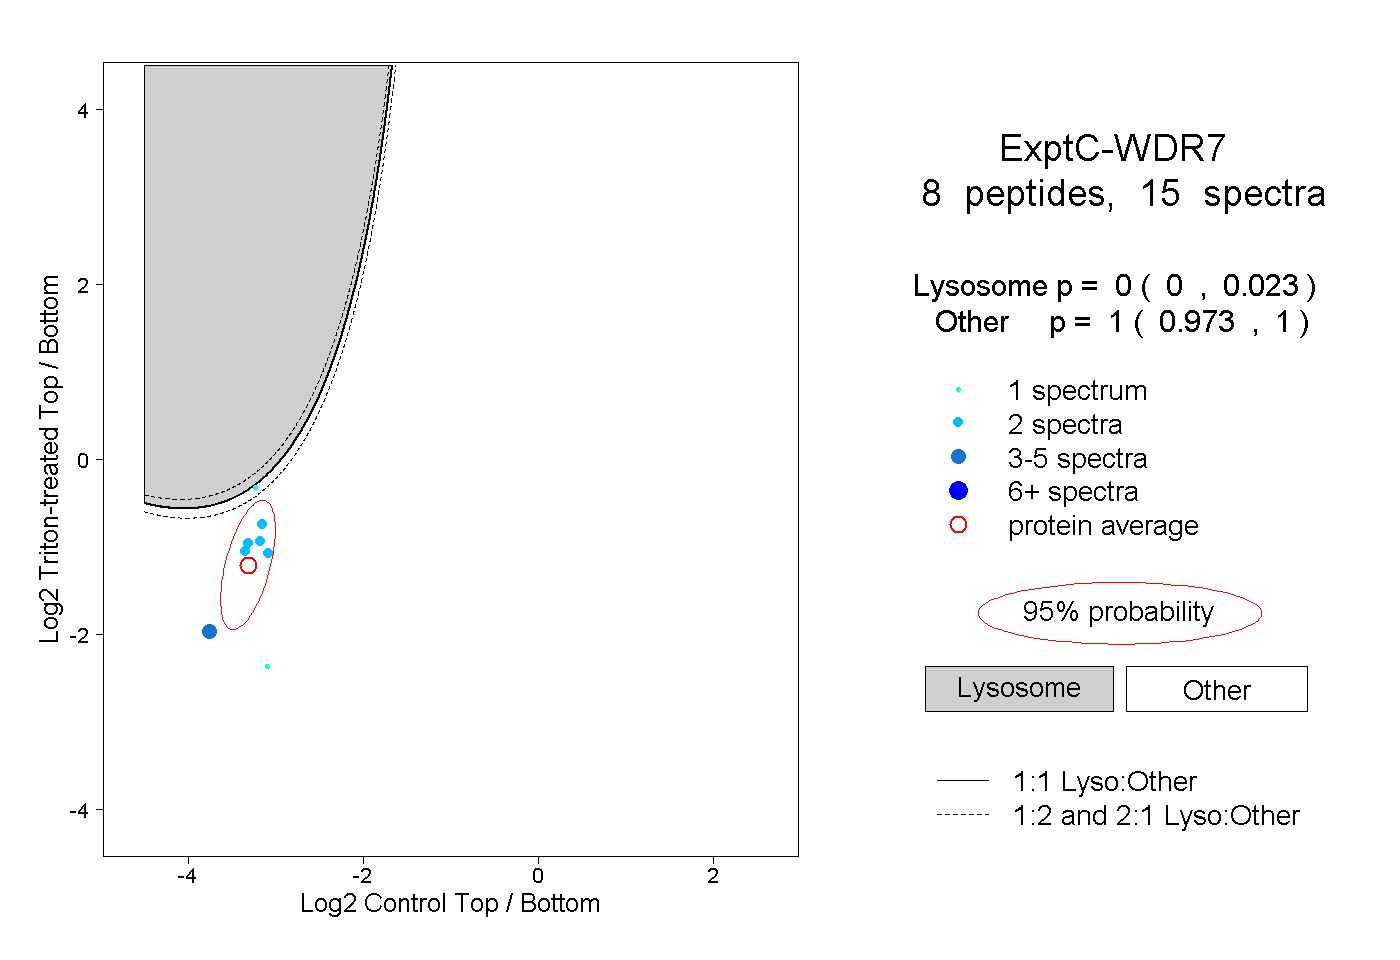
0.000 | 0.023
0.973 | 1.000
1peptide
spectra
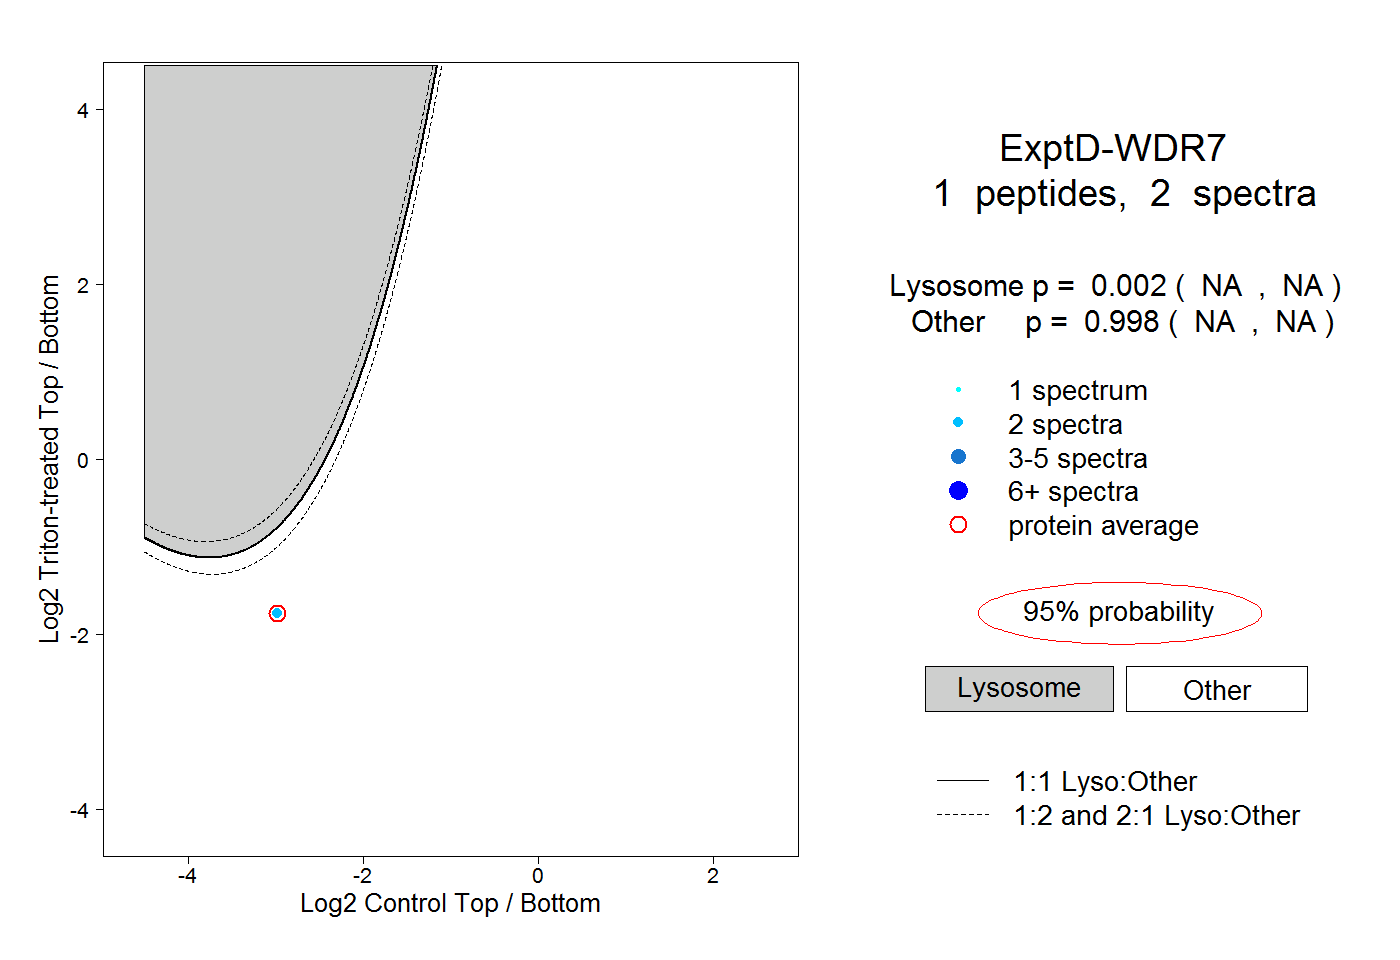
NA | NA
NA | NA