 12
12peptides
spectra
0.000 | 0.000
0.095 | 0.135
0.088 | 0.134
0.000 | 0.000
0.325 | 0.369
0.045 | 0.088
0.346 | 0.358
0.000 | 0.000
| Plot | Mito | Lyso | Perox | ER | Golgi | PM | Cytosol | Nucleus | |||||
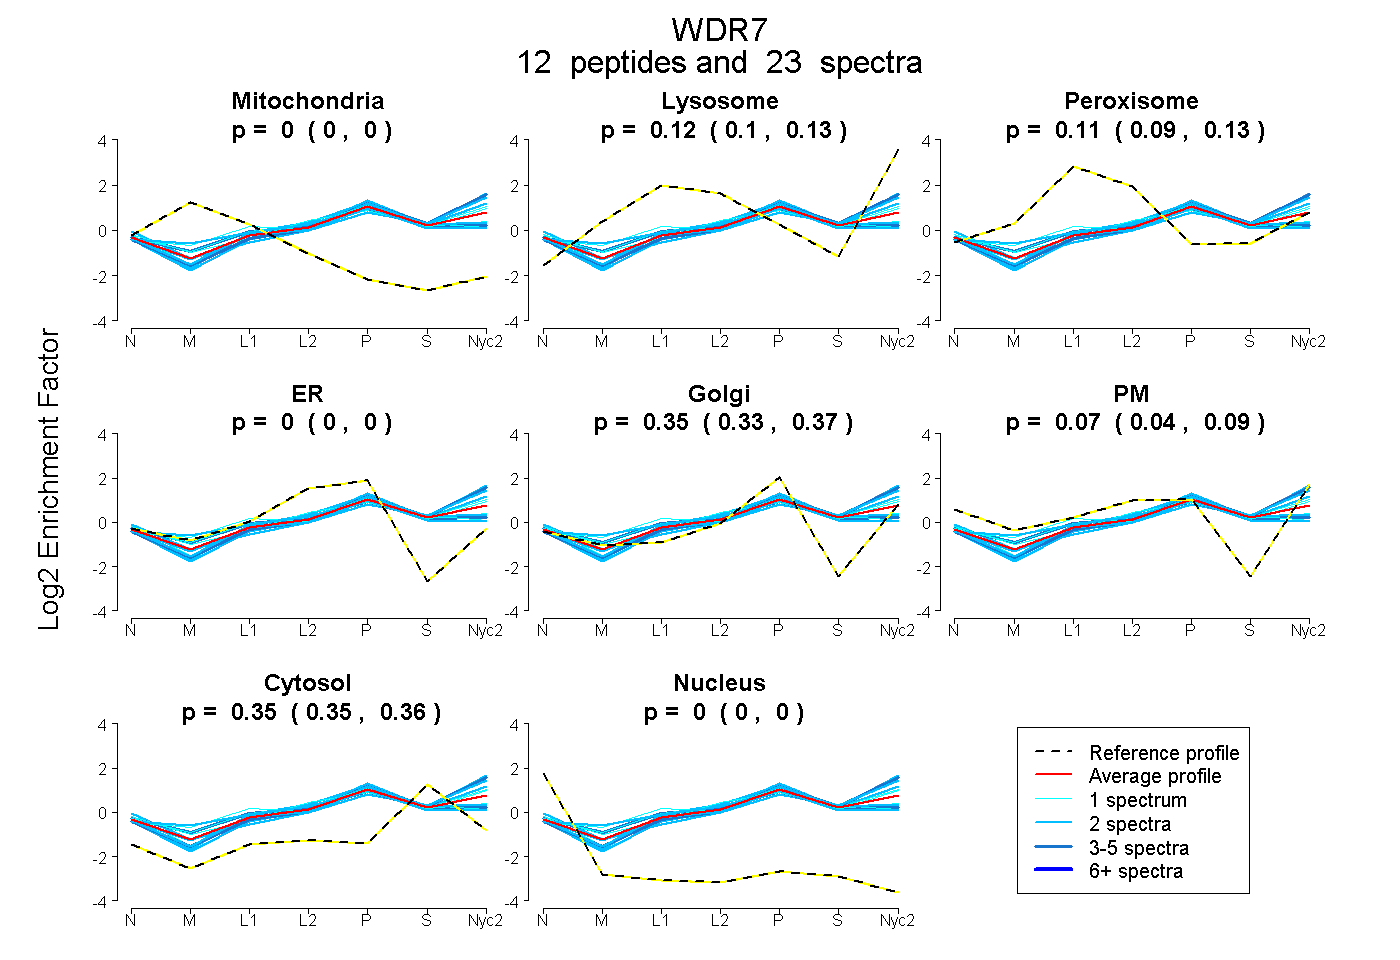
| Expt A |
12 peptides |
23 spectra |
|
0.000 0.000 | 0.000 |
0.116 0.095 | 0.135 |
0.114 0.088 | 0.134 |
0.000 0.000 | 0.000 |
0.349 0.325 | 0.369 |
0.068 0.045 | 0.088 |
0.352 0.346 | 0.358 |
0.000 0.000 | 0.000 |
| 2 spectra, VTCLLYPHQVSAR | 0.000 | 0.000 | 0.273 | 0.068 | 0.355 | 0.000 | 0.304 | 0.000 | ||
| 1 spectrum, LACTHTGIQFYQFSVGNQR | 0.000 | 0.016 | 0.304 | 0.000 | 0.390 | 0.000 | 0.290 | 0.000 | ||
| 3 spectra, ISPDWISSMSIIR | 0.000 | 0.275 | 0.000 | 0.000 | 0.353 | 0.020 | 0.352 | 0.000 | ||
| 4 spectra, ALLFGHTAAITCLSK | 0.000 | 0.000 | 0.276 | 0.000 | 0.404 | 0.000 | 0.320 | 0.000 | ||
| 1 spectrum, ELVICPPVTR | 0.000 | 0.000 | 0.163 | 0.070 | 0.342 | 0.017 | 0.408 | 0.000 | ||
| 2 spectra, ACASGDK | 0.000 | 0.000 | 0.112 | 0.017 | 0.248 | 0.190 | 0.433 | 0.000 | ||
| 2 spectra, EAAQALLLAELR | 0.000 | 0.213 | 0.000 | 0.000 | 0.424 | 0.000 | 0.363 | 0.000 | ||
| 1 spectrum, HLFPIQVIK | 0.000 | 0.169 | 0.013 | 0.000 | 0.126 | 0.320 | 0.373 | 0.000 | ||
| 2 spectra, FRPPLLEMLAR | 0.000 | 0.287 | 0.000 | 0.000 | 0.283 | 0.102 | 0.328 | 0.000 | ||
| 1 spectrum, TTTCISLQDAFDK | 0.000 | 0.156 | 0.122 | 0.000 | 0.323 | 0.095 | 0.304 | 0.000 | ||
| 2 spectra, LLIQGDSSGR | 0.000 | 0.263 | 0.000 | 0.000 | 0.245 | 0.118 | 0.373 | 0.000 | ||
| 2 spectra, LPASCLPASDSFR | 0.000 | 0.000 | 0.199 | 0.000 | 0.438 | 0.000 | 0.363 | 0.000 |
| Plot | Mito | Lyso or Perox | ER | Golgi | PM | Cytosol | Nucleus | ||||||
| Expt B |
2 peptides |
2 spectra |
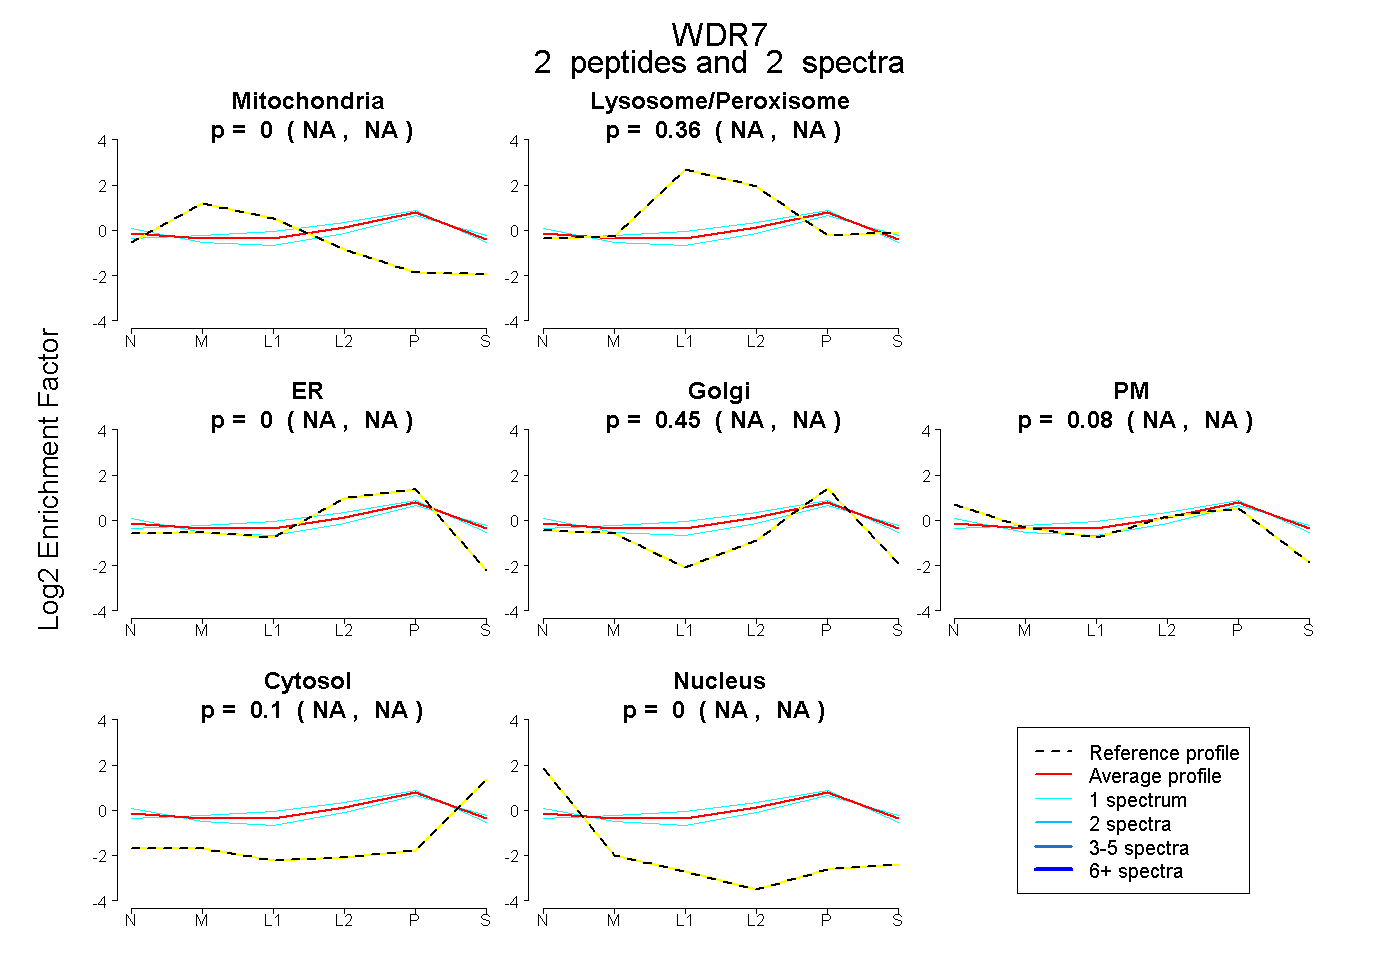 |
0.000 NA | NA |
0.361 NA | NA |
0.000 NA | NA |
0.450 NA | NA |
0.084 NA | NA |
0.105 NA | NA |
0.000 NA | NA |
|||
| Plot | Lyso | Other | |||||||||||
| Expt C |
8 peptides |
15 spectra |
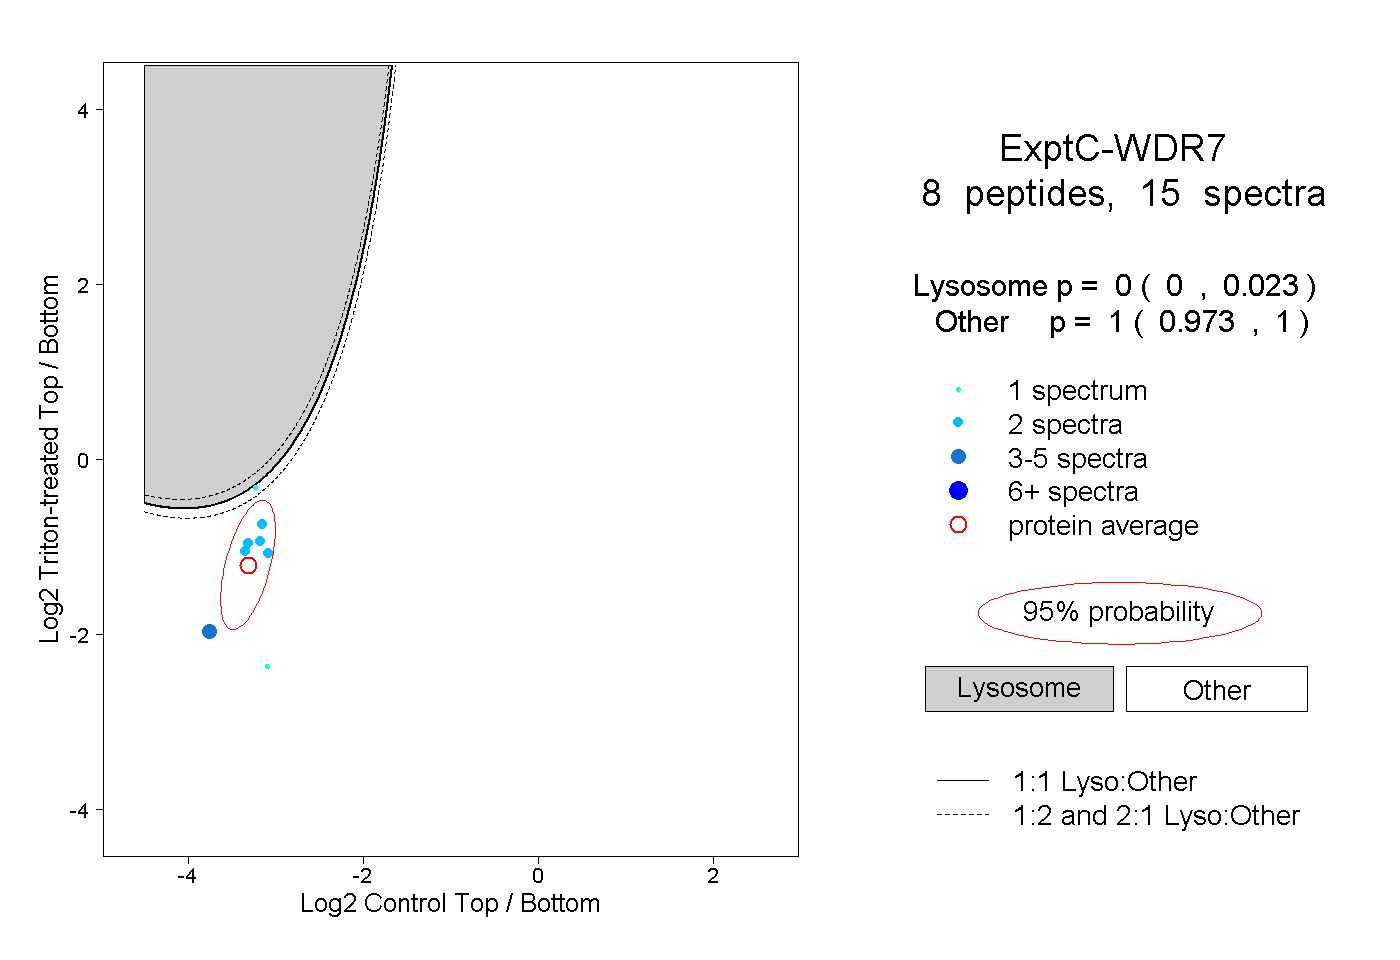 |
0.000 0.000 | 0.023 |
1.000 0.973 | 1.000 |
||||||||
| Plot | Lyso | Other | |||||||||||
| Expt D |
1 peptide |
2 spectra |
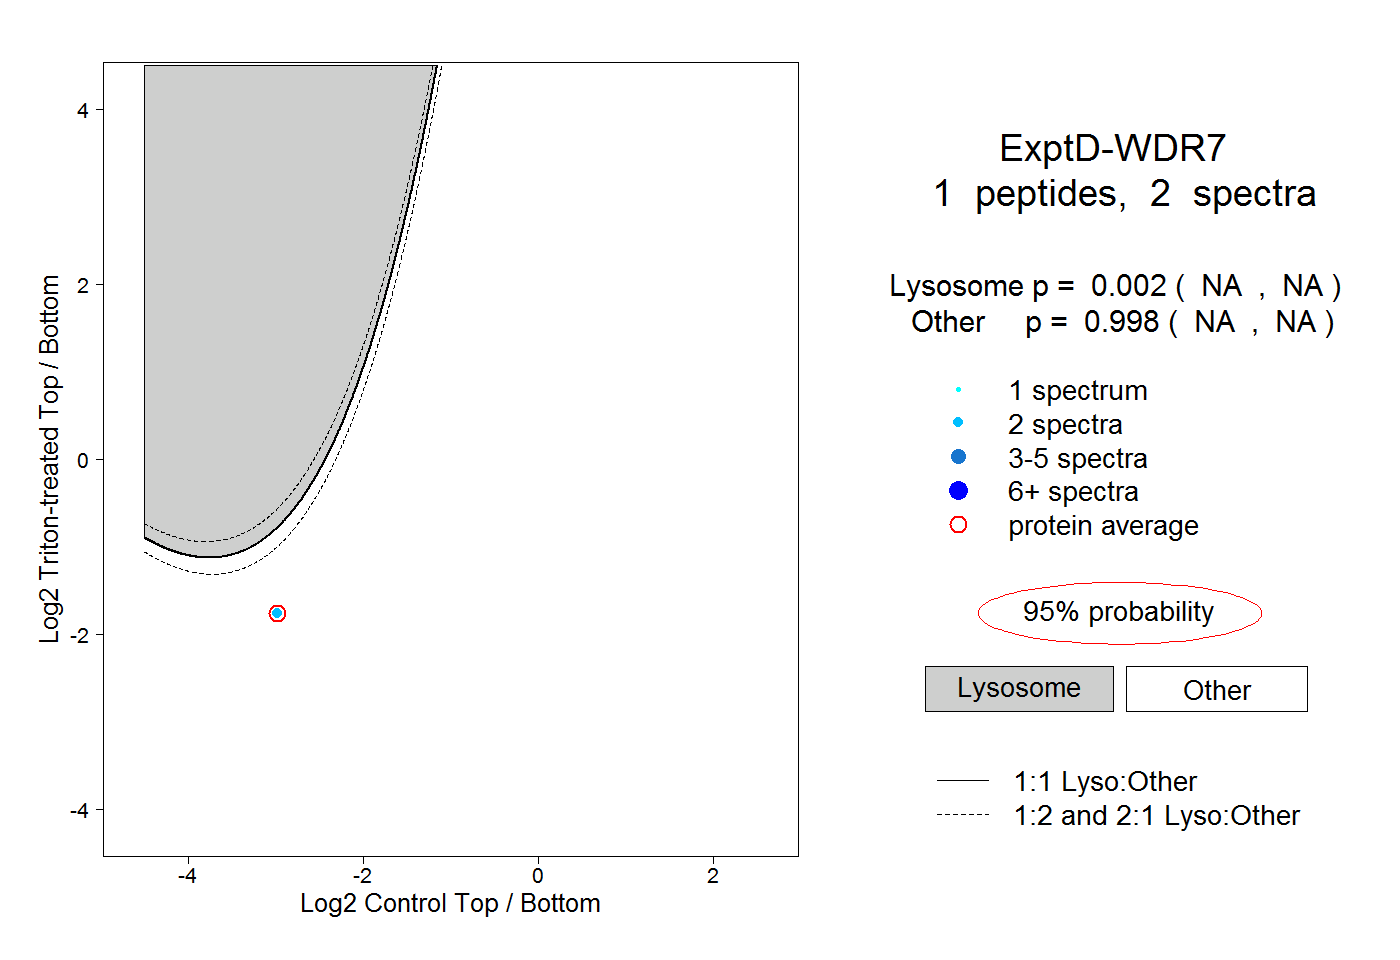 |
0.002 NA | NA |
0.998 NA | NA |