 21
21peptides
spectra
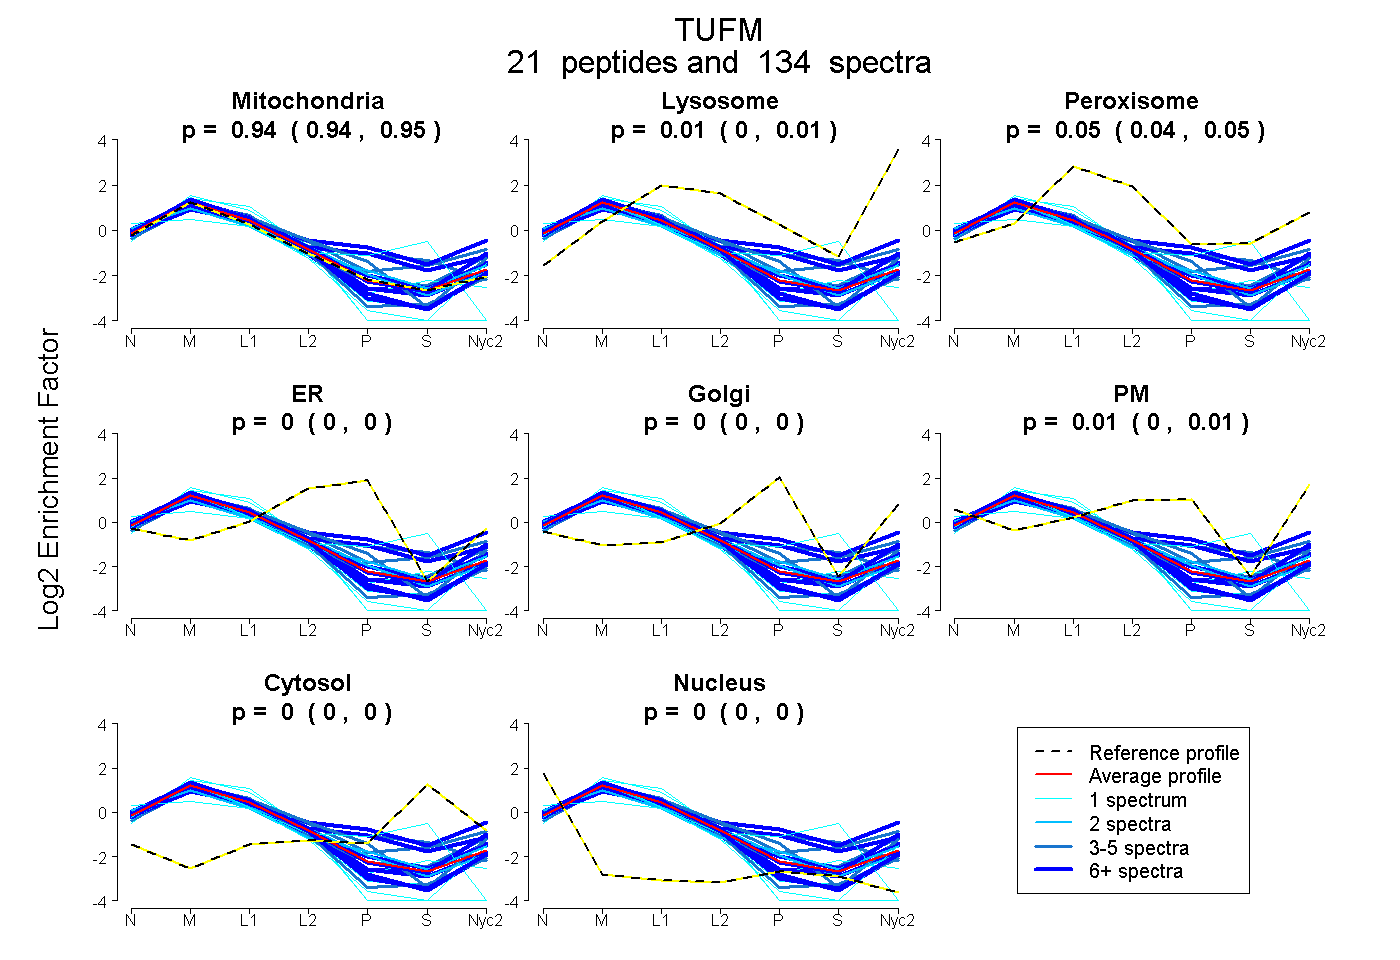
0.938 | 0.946
0.000 | 0.014
0.038 | 0.052
0.000 | 0.000
0.000 | 0.000
0.000 | 0.011
0.000 | 0.000
0.000 | 0.000
19peptides
spectra
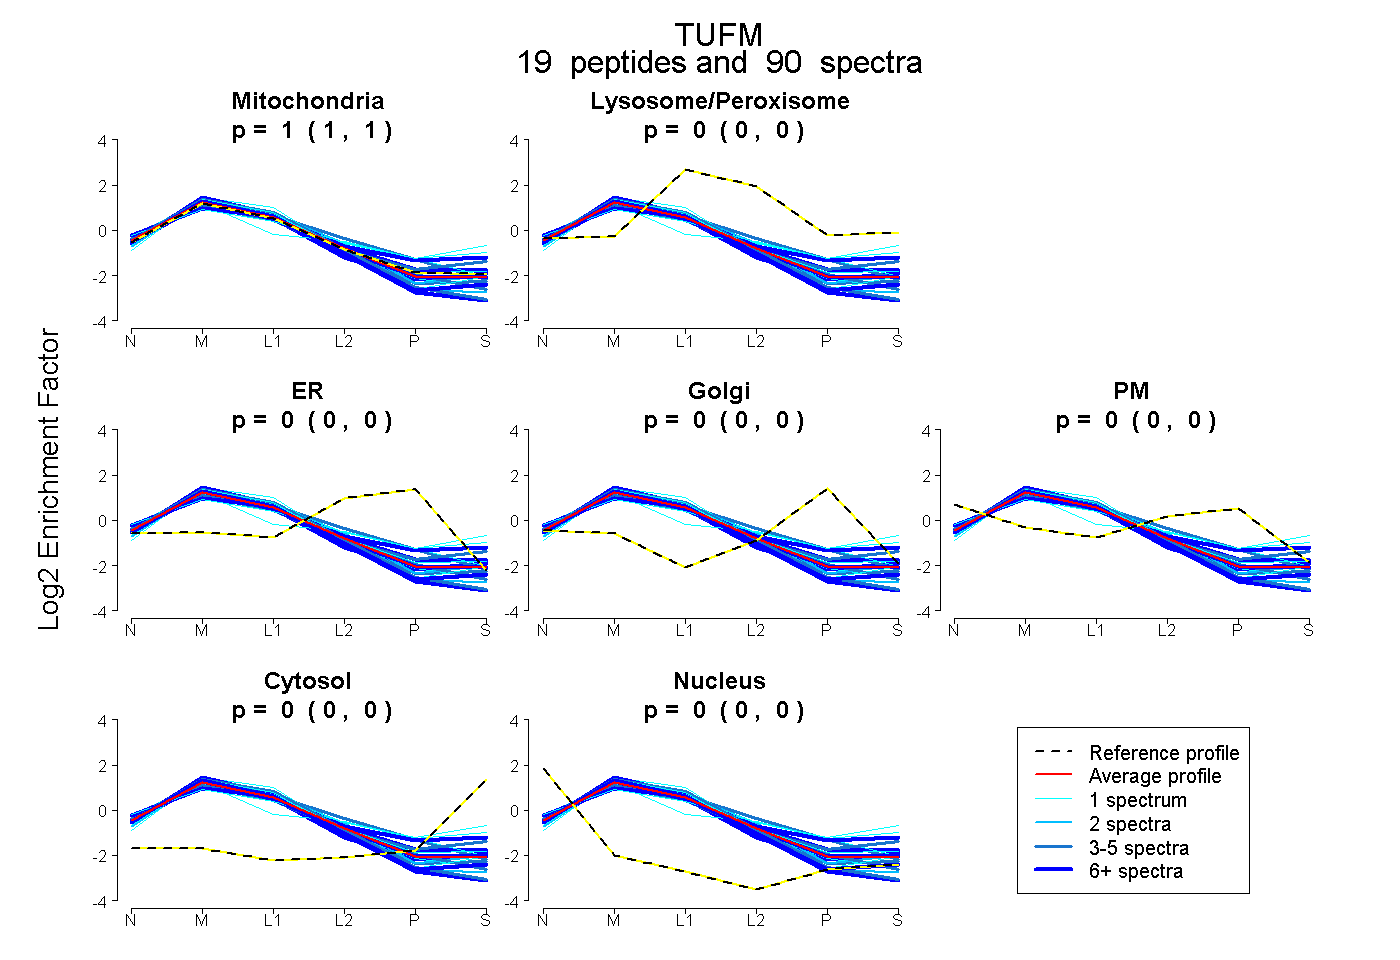
0.998 | 1.000
0.000 | 0.000
0.000 | 0.000
0.000 | 0.000
0.000 | 0.000
0.000 | 0.000
0.000 | 0.002
22peptides
spectra
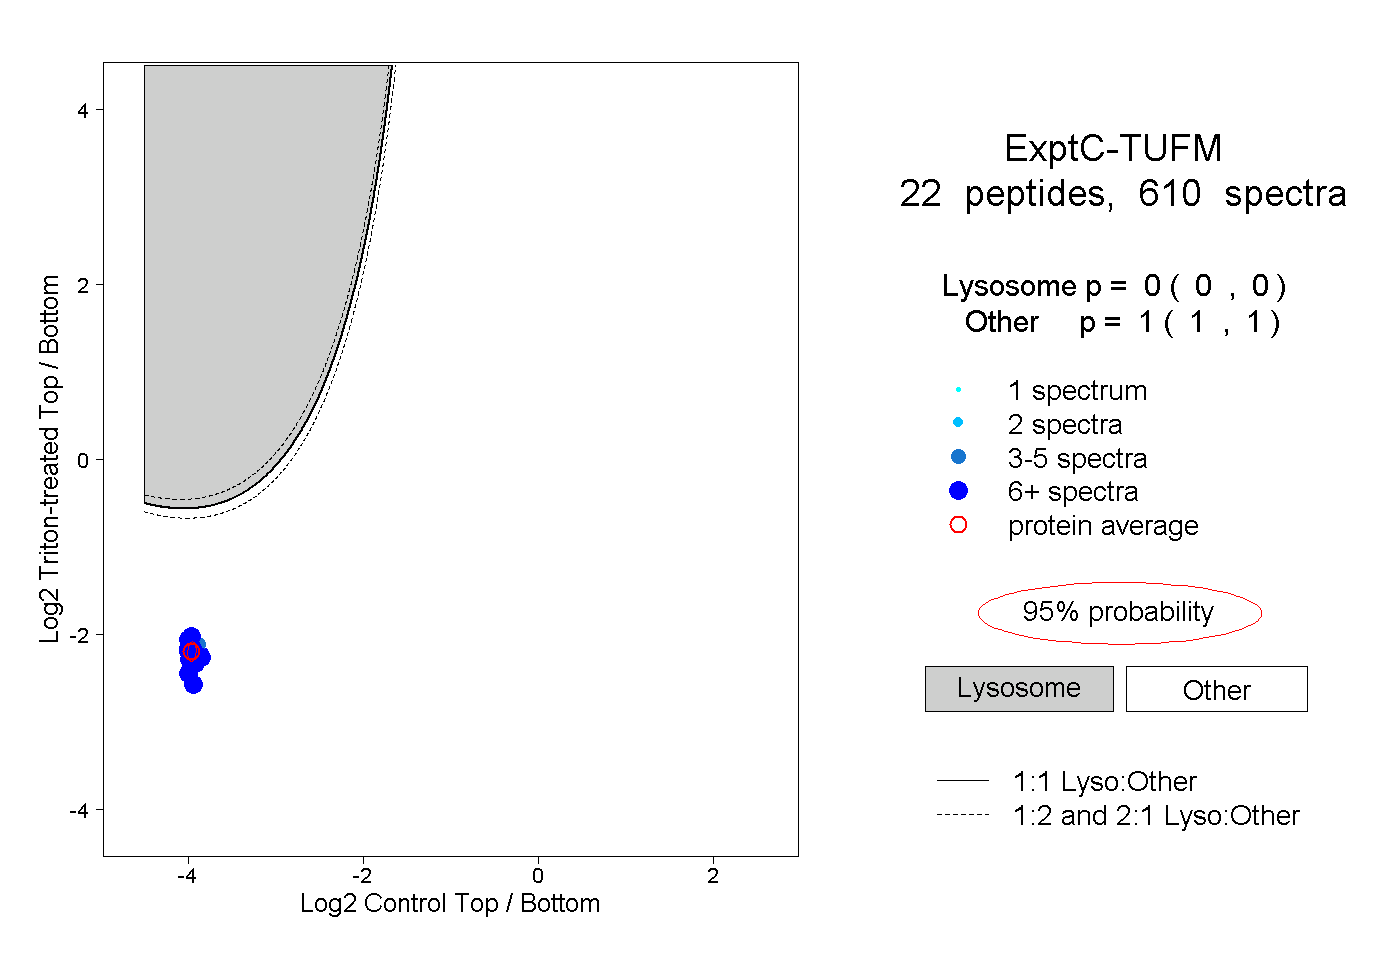
0.000 | 0.000
1.000 | 1.000
16peptides
spectra
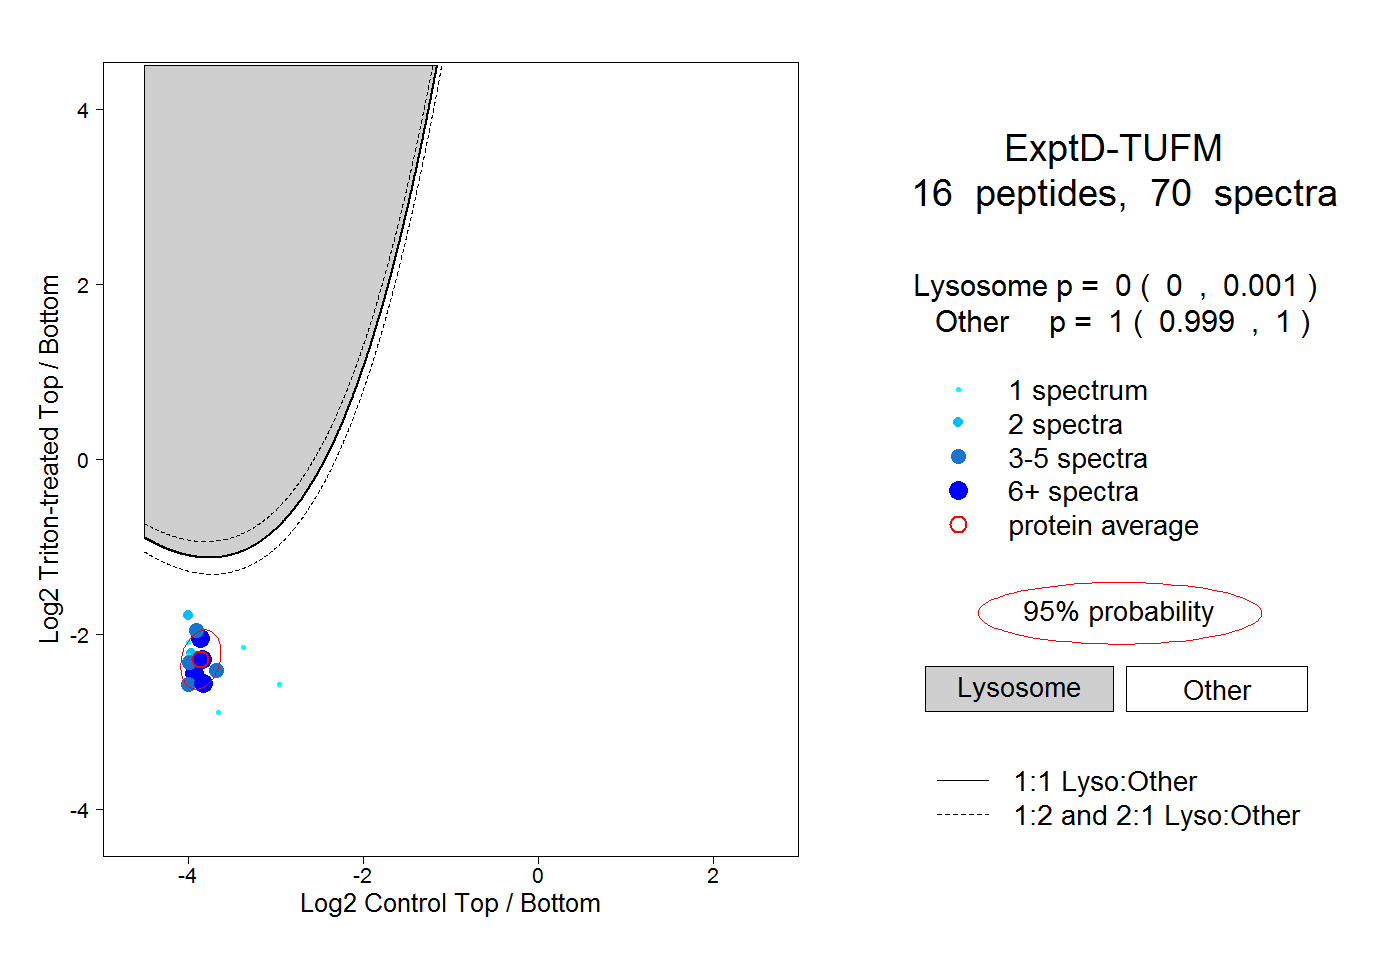
0.000 | 0.001
0.999 | 1.000