 21
21peptides
spectra
0.938 | 0.946
0.000 | 0.014
0.038 | 0.052
0.000 | 0.000
0.000 | 0.000
0.000 | 0.011
0.000 | 0.000
0.000 | 0.000
| Plot | Mito | Lyso | Perox | ER | Golgi | PM | Cytosol | Nucleus | |||||
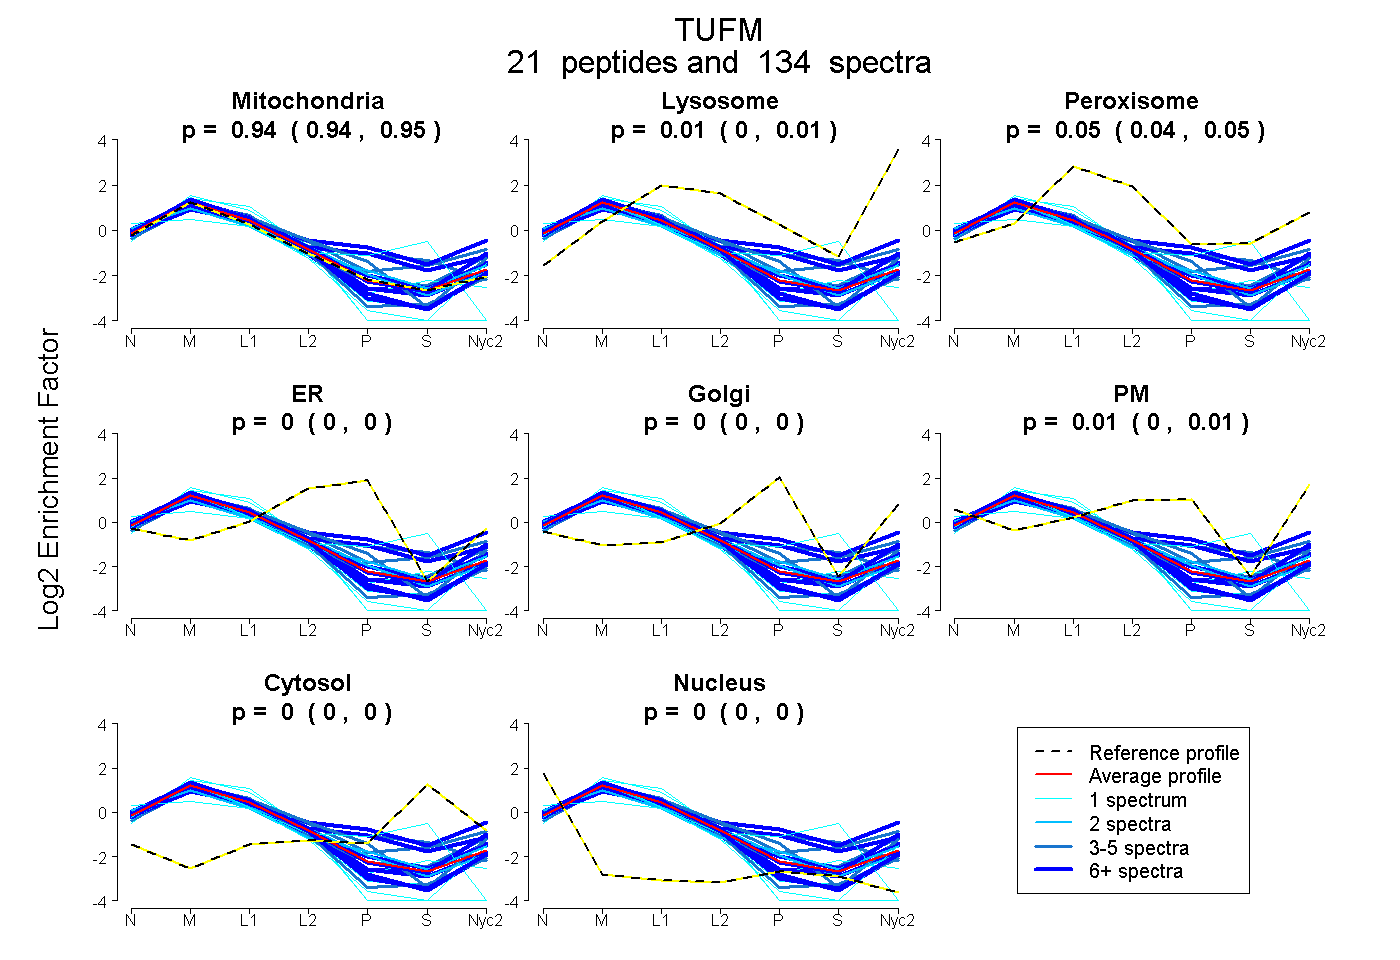
| Expt A |
21 peptides |
134 spectra |
|
0.942 0.938 | 0.946 |
0.007 0.000 | 0.014 |
0.046 0.038 | 0.052 |
0.000 0.000 | 0.000 |
0.000 0.000 | 0.000 |
0.005 0.000 | 0.011 |
0.000 0.000 | 0.000 |
0.000 0.000 | 0.000 |
| 1 spectrum, VEAQVYILSK | 1.000 | 0.000 | 0.000 | 0.000 | 0.000 | 0.000 | 0.000 | 0.000 | ||
| 2 spectra, TTLTAAITK | 0.936 | 0.003 | 0.000 | 0.061 | 0.000 | 0.000 | 0.000 | 0.000 | ||
| 11 spectra, GTVVTGTLER | 0.996 | 0.000 | 0.004 | 0.000 | 0.000 | 0.000 | 0.000 | 0.000 | ||
| 17 spectra, YEEIDNAPEER | 1.000 | 0.000 | 0.000 | 0.000 | 0.000 | 0.000 | 0.000 | 0.000 | ||
| 6 spectra, HYAHTDCPGHADYVK | 0.672 | 0.000 | 0.160 | 0.000 | 0.139 | 0.000 | 0.030 | 0.000 | ||
| 8 spectra, LLDAVDTYIPVPTR | 1.000 | 0.000 | 0.000 | 0.000 | 0.000 | 0.000 | 0.000 | 0.000 | ||
| 1 spectrum, GLVMVKPGSIQPHQK | 0.978 | 0.000 | 0.000 | 0.000 | 0.000 | 0.000 | 0.000 | 0.022 | ||
| 3 spectra, EHLLLAK | 0.686 | 0.076 | 0.091 | 0.000 | 0.000 | 0.044 | 0.102 | 0.000 | ||
| 2 spectra, QPMILEK | 0.838 | 0.000 | 0.000 | 0.000 | 0.000 | 0.119 | 0.000 | 0.042 | ||
| 1 spectrum, ADAVQDSEMVELVELEIR | 1.000 | 0.000 | 0.000 | 0.000 | 0.000 | 0.000 | 0.000 | 0.000 | ||
| 3 spectra, QIGVEHVVVYVNK | 0.999 | 0.000 | 0.000 | 0.000 | 0.000 | 0.000 | 0.000 | 0.001 | ||
| 14 spectra, AEAGDNLGALVR | 0.928 | 0.035 | 0.037 | 0.000 | 0.000 | 0.000 | 0.000 | 0.000 | ||
| 4 spectra, DLEKPFLLPVESVYSIPGR | 0.889 | 0.107 | 0.000 | 0.000 | 0.000 | 0.000 | 0.000 | 0.004 | ||
| 1 spectrum, DPELGVK | 1.000 | 0.000 | 0.000 | 0.000 | 0.000 | 0.000 | 0.000 | 0.000 | ||
| 3 spectra, ELAMPGEDLK | 0.716 | 0.000 | 0.083 | 0.071 | 0.000 | 0.000 | 0.130 | 0.000 | ||
| 19 spectra, LSLIIR | 0.903 | 0.037 | 0.000 | 0.000 | 0.000 | 0.053 | 0.000 | 0.007 | ||
| 13 spectra, GITINAAHVEYSTAAR | 0.541 | 0.103 | 0.097 | 0.000 | 0.085 | 0.097 | 0.076 | 0.000 | ||
| 19 spectra, TVVTGIEMFHK | 0.877 | 0.123 | 0.000 | 0.000 | 0.000 | 0.000 | 0.000 | 0.000 | ||
| 4 spectra, ILAEGGGAK | 0.796 | 0.034 | 0.000 | 0.064 | 0.000 | 0.106 | 0.000 | 0.000 | ||
| 1 spectrum, VILPPGK | 0.704 | 0.000 | 0.000 | 0.000 | 0.000 | 0.000 | 0.225 | 0.071 | ||
| 1 spectrum, GEETPVIVGSALCALEQR | 0.987 | 0.000 | 0.000 | 0.000 | 0.000 | 0.000 | 0.000 | 0.013 |
| Plot | Mito | Lyso or Perox | ER | Golgi | PM | Cytosol | Nucleus | ||||||
| Expt B |
19 peptides |
90 spectra |
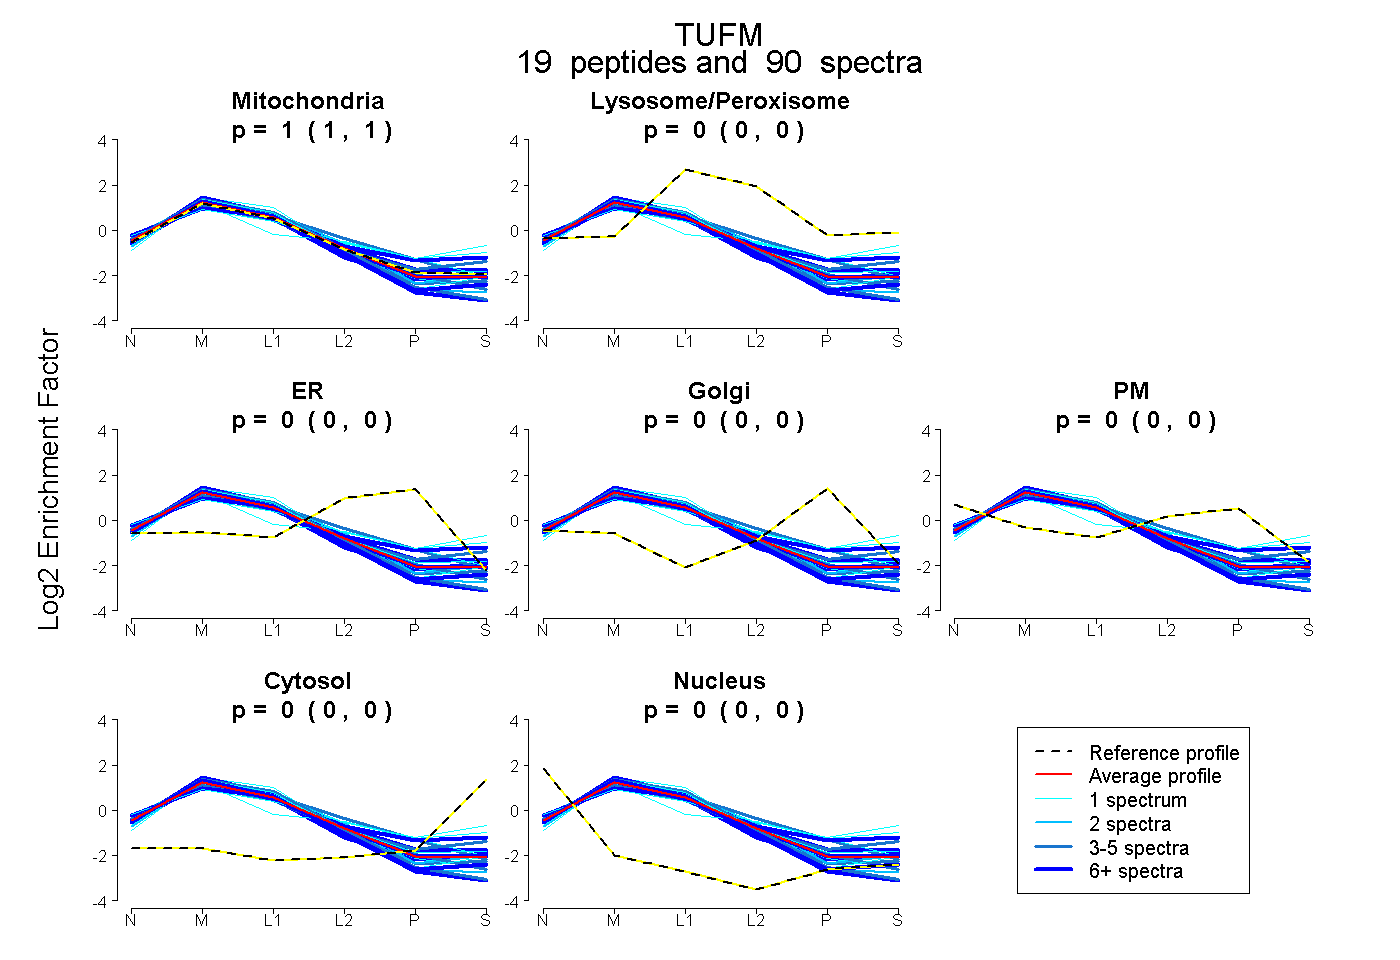 |
0.999 0.998 | 1.000 |
0.000 0.000 | 0.000 |
0.000 0.000 | 0.000 |
0.000 0.000 | 0.000 |
0.000 0.000 | 0.000 |
0.000 0.000 | 0.000 |
0.001 0.000 | 0.002 |
|||
| Plot | Lyso | Other | |||||||||||
| Expt C |
22 peptides |
610 spectra |
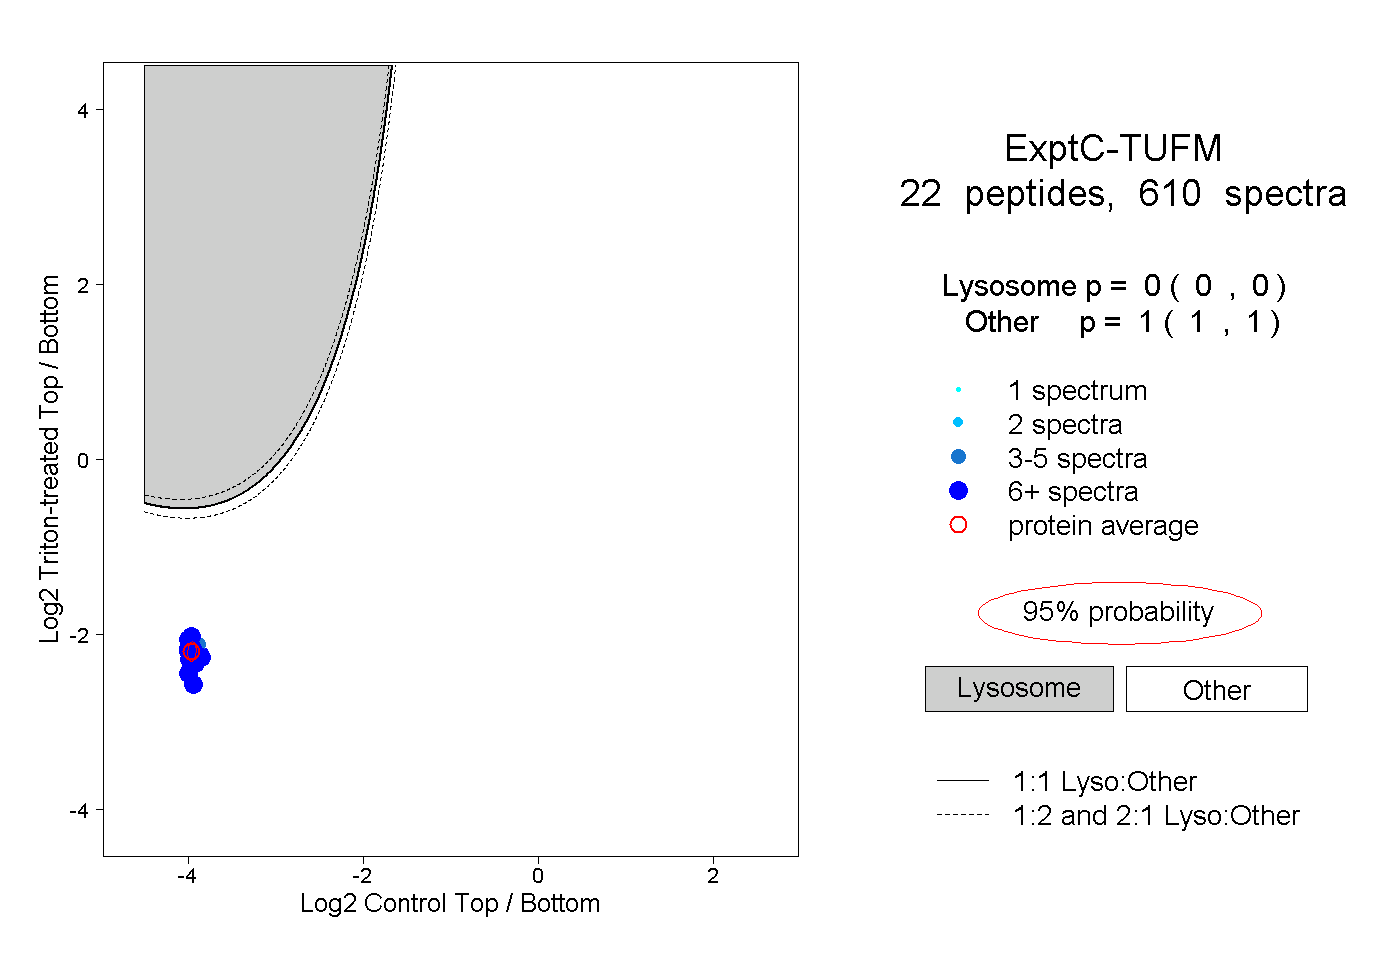 |
0.000 0.000 | 0.000 |
1.000 1.000 | 1.000 |
||||||||
| Plot | Lyso | Other | |||||||||||
| Expt D |
16 peptides |
70 spectra |
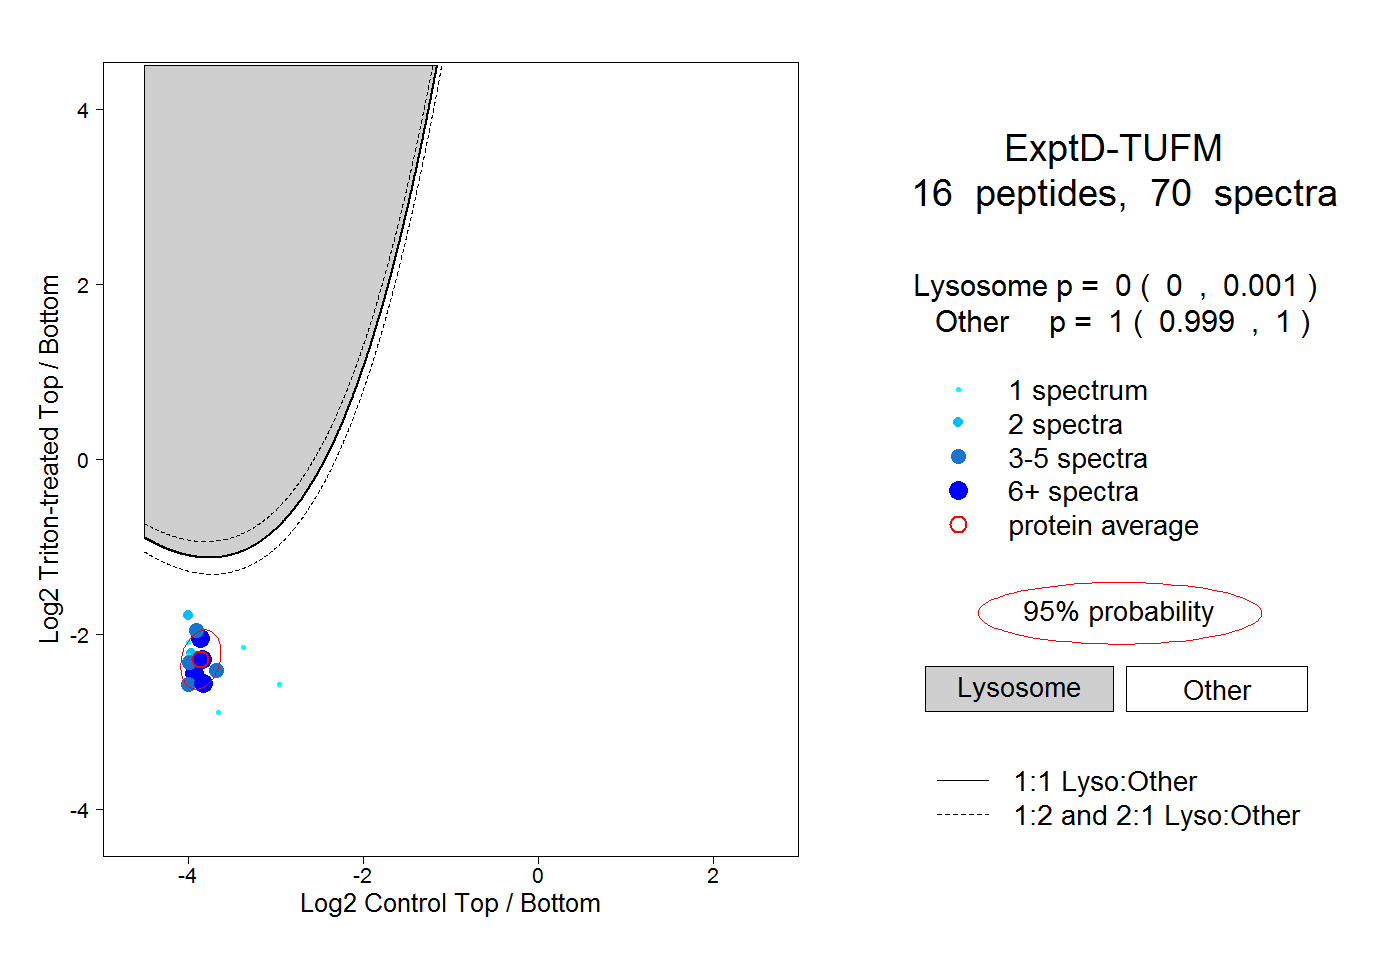 |
0.000 0.000 | 0.001 |
1.000 0.999 | 1.000 |