 2
2peptides
spectra
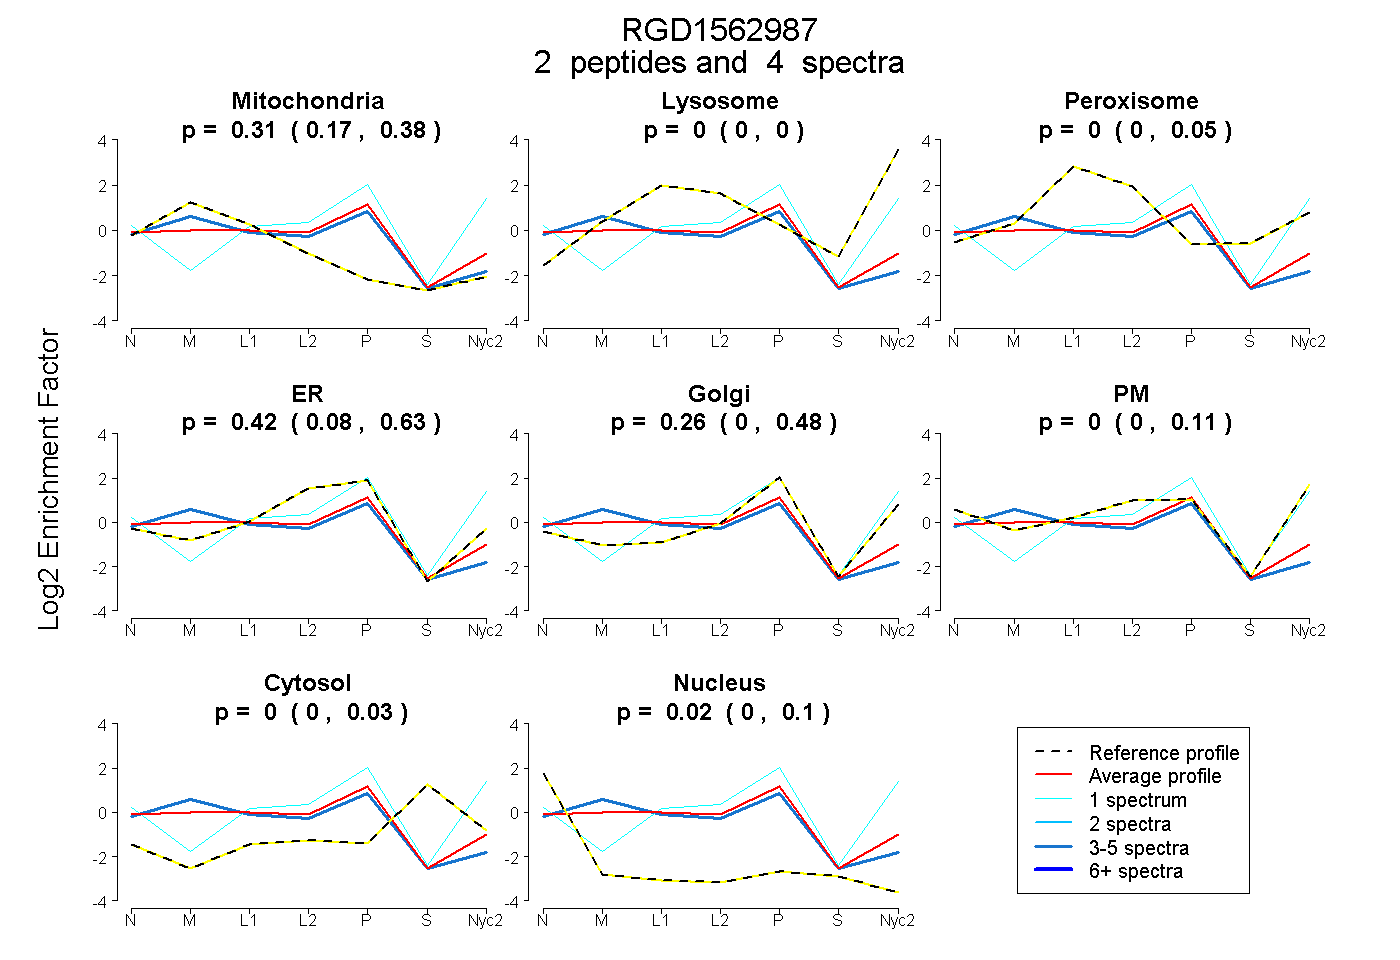
0.171 | 0.385
0.000 | 0.000
0.000 | 0.045
0.079 | 0.630
0.000 | 0.481
0.000 | 0.110
0.000 | 0.031
0.000 | 0.103
1peptide
spectra
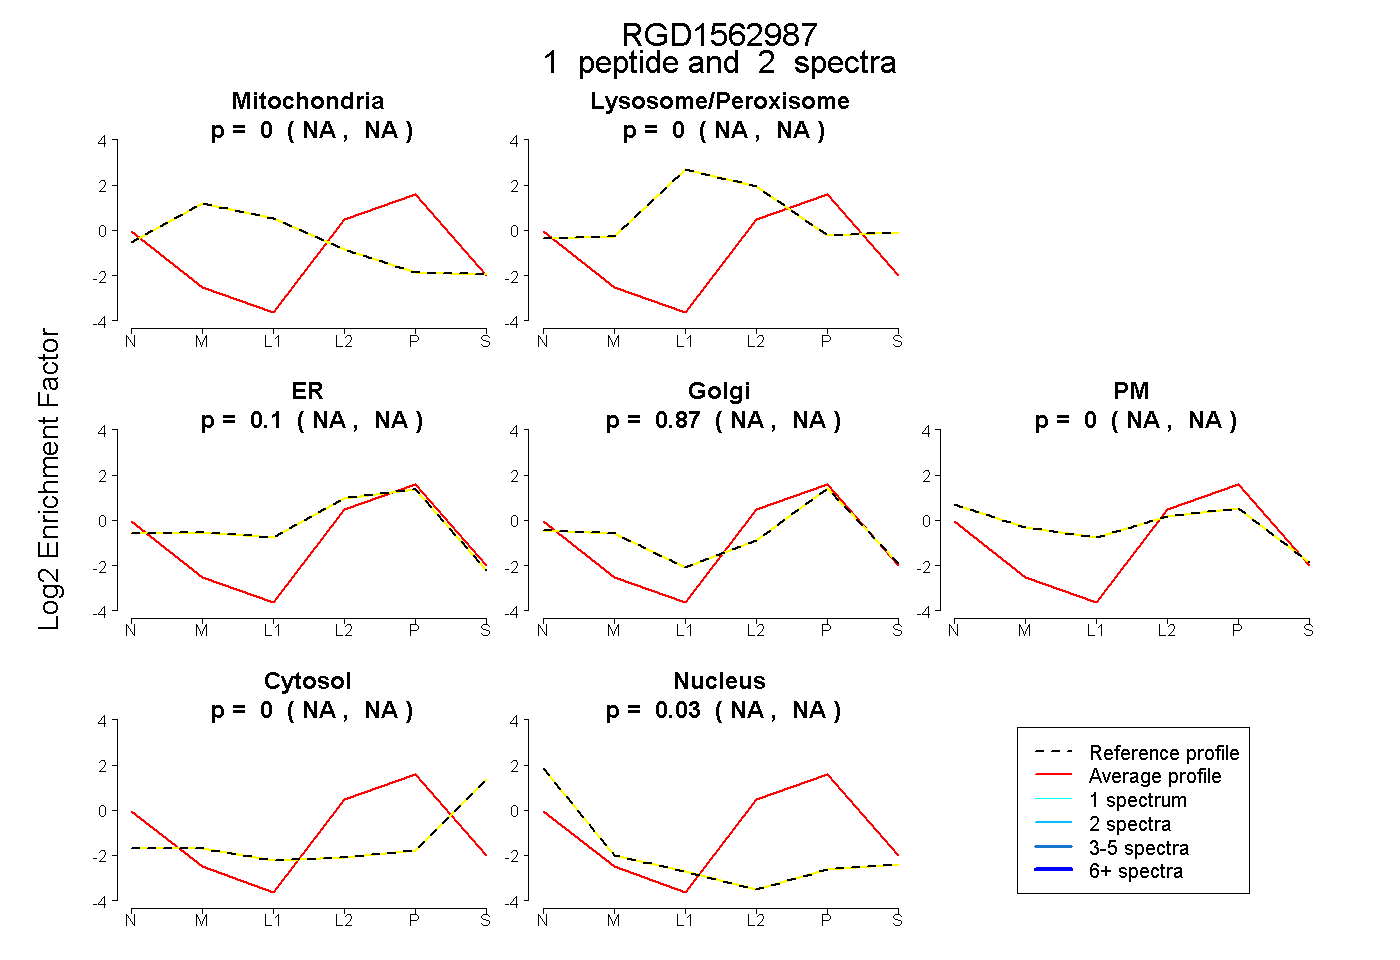
NA | NA
NA | NA
NA | NA
NA | NA
NA | NA
NA | NA
NA | NA
2peptides
spectra
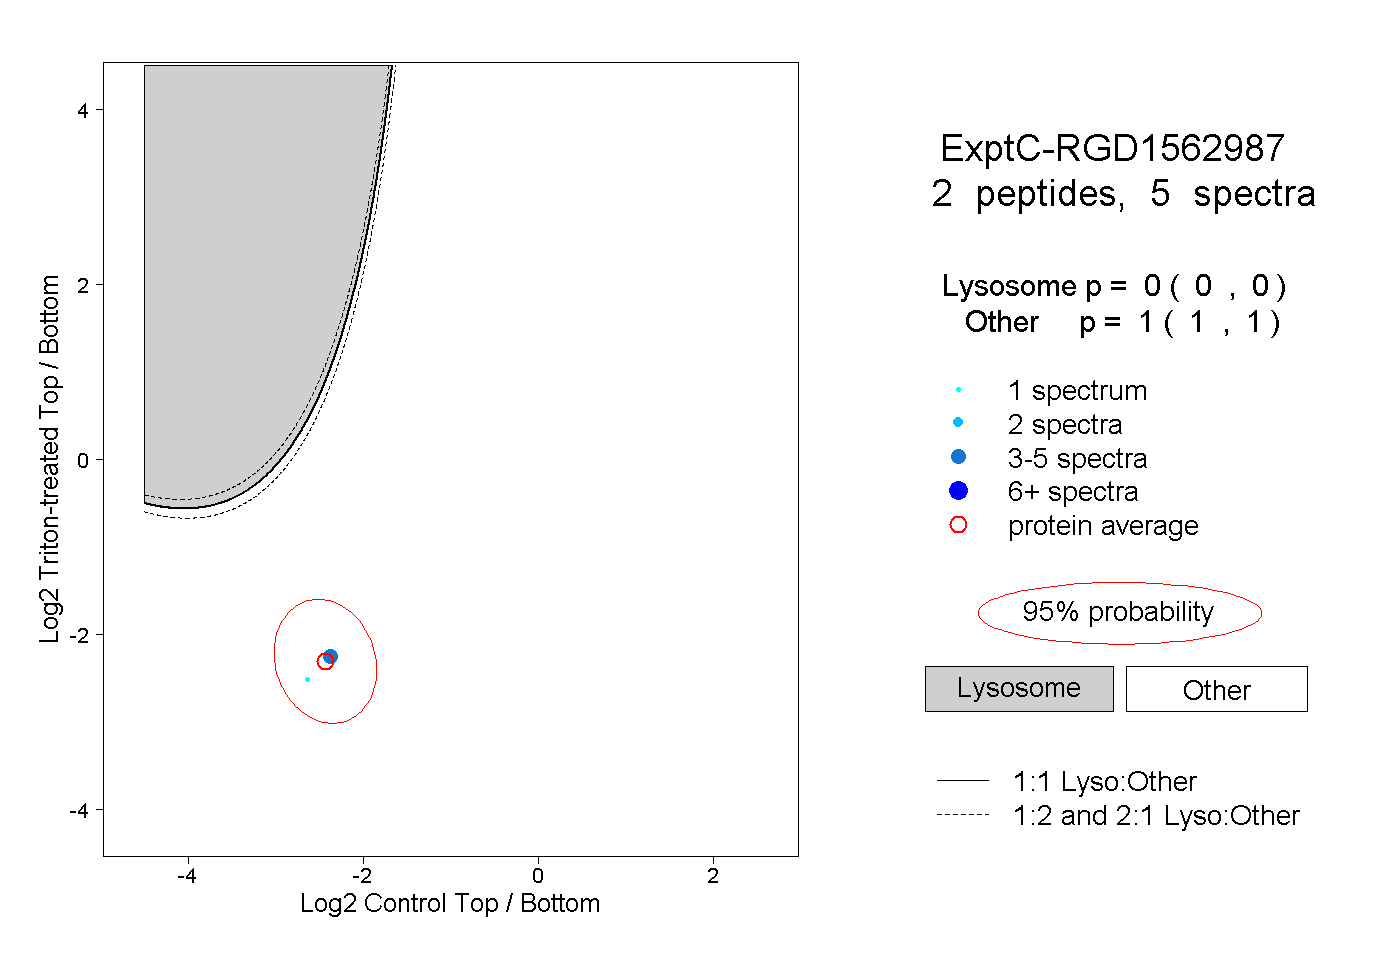
0.000 | 0.000
1.000 | 1.000