 2
2peptides
spectra
0.171 | 0.385
0.000 | 0.000
0.000 | 0.045
0.079 | 0.630
0.000 | 0.481
0.000 | 0.110
0.000 | 0.031
0.000 | 0.103
| Plot | Mito | Lyso | Perox | ER | Golgi | PM | Cytosol | Nucleus | |||||
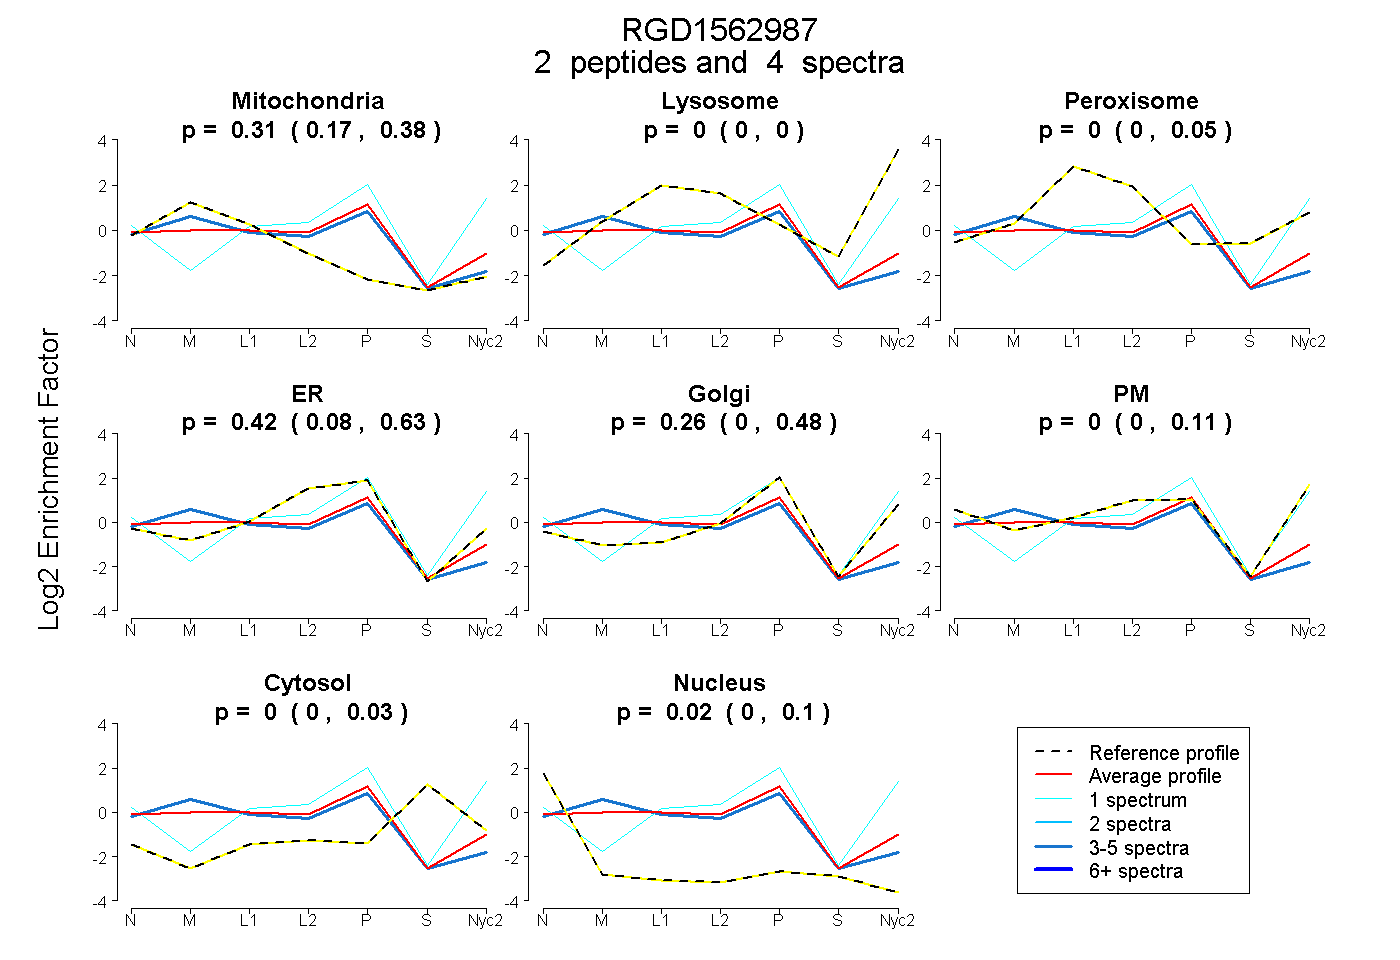
| Expt A |
2 peptides |
4 spectra |
|
0.312 0.171 | 0.385 |
0.000 0.000 | 0.000 |
0.000 0.000 | 0.045 |
0.417 0.079 | 0.630 |
0.255 0.000 | 0.481 |
0.000 0.000 | 0.110 |
0.000 0.000 | 0.031 |
0.015 0.000 | 0.103 |
| 1 spectrum, GPTEVSDK | 0.000 | 0.000 | 0.000 | 0.012 | 0.580 | 0.408 | 0.000 | 0.000 | ||
| 3 spectra, AVQQLDNK | 0.450 | 0.000 | 0.000 | 0.465 | 0.063 | 0.000 | 0.000 | 0.022 |
| Plot | Mito | Lyso or Perox | ER | Golgi | PM | Cytosol | Nucleus | ||||||
| Expt B |
1 peptide |
2 spectra |
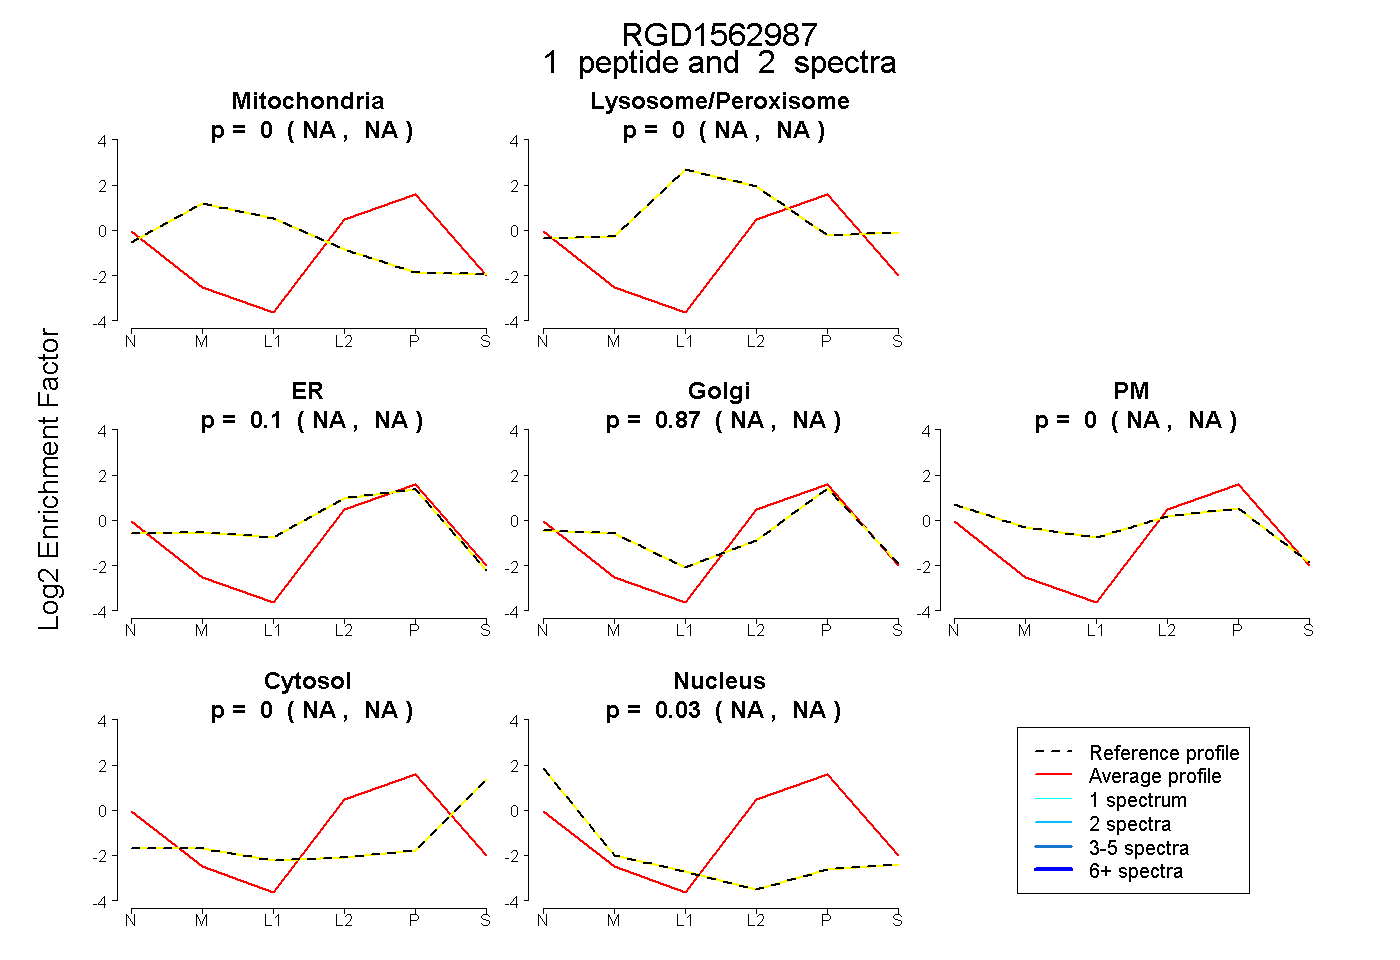 |
0.000 NA | NA |
0.000 NA | NA |
0.097 NA | NA |
0.874 NA | NA |
0.000 NA | NA |
0.000 NA | NA |
0.029 NA | NA |
|||
| Plot | Lyso | Other | |||||||||||
| Expt C |
2 peptides |
5 spectra |
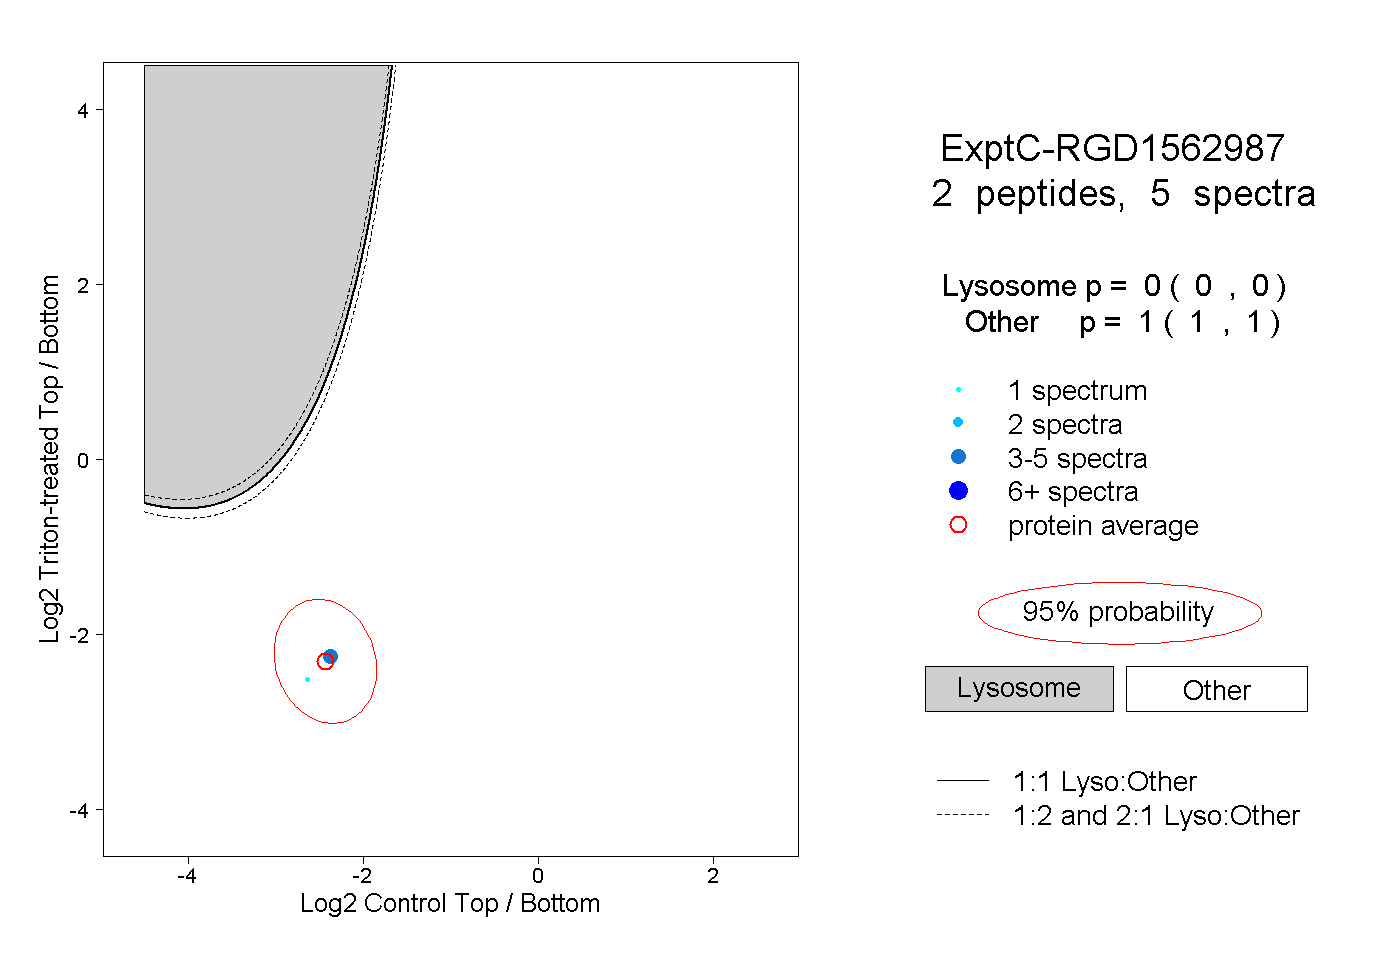 |
0.000 0.000 | 0.000 |
1.000 1.000 | 1.000 |