 8
8peptides
spectra
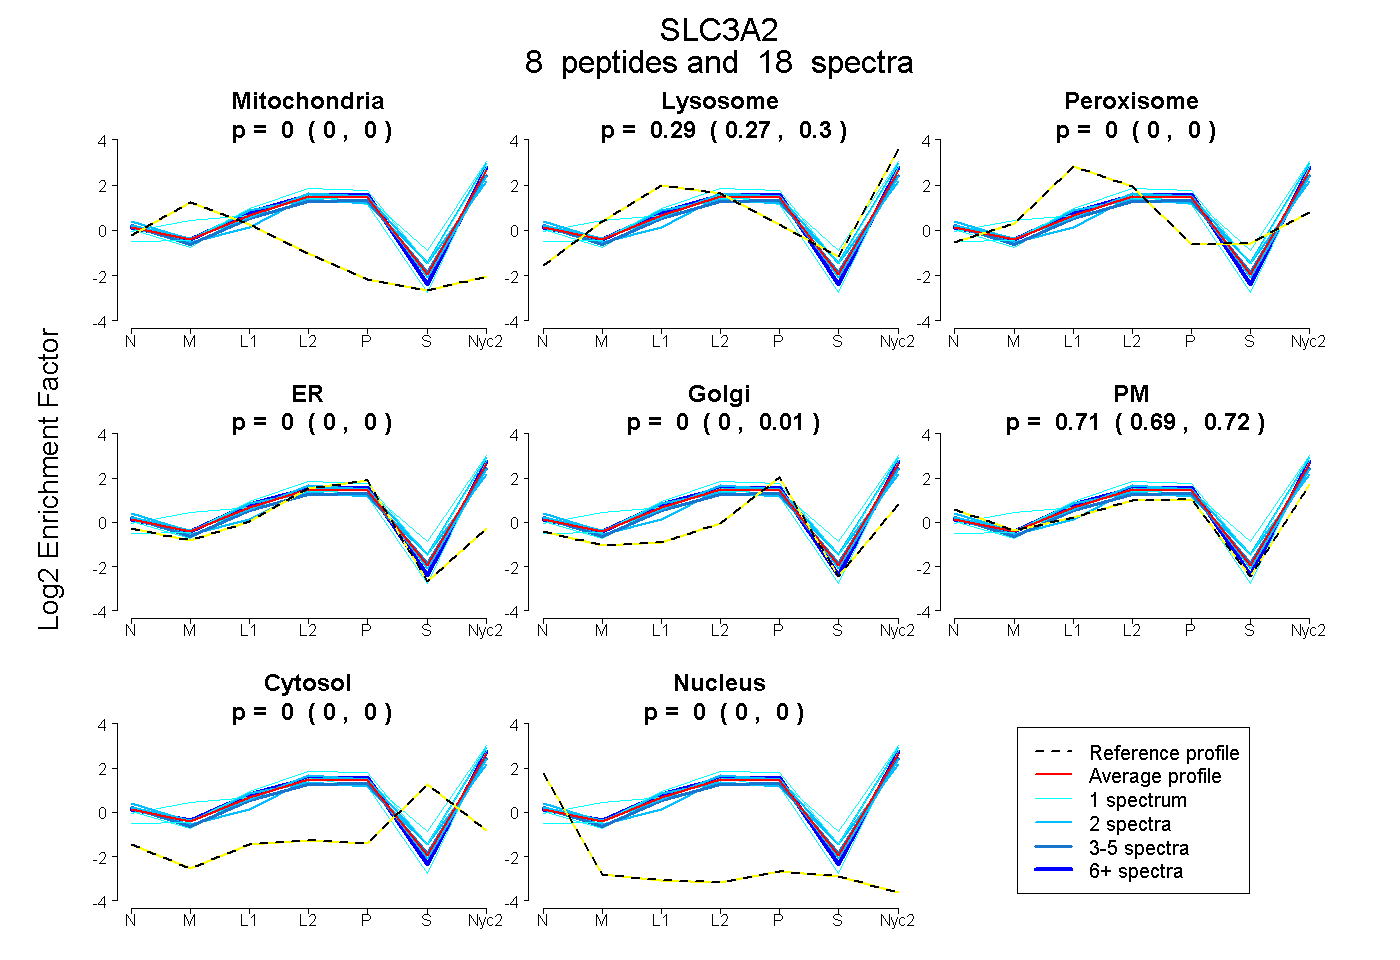
0.000 | 0.000
0.275 | 0.299
0.000 | 0.000
0.000 | 0.000
0.000 | 0.008
0.694 | 0.723
0.000 | 0.000
0.000 | 0.000
2peptides
spectra
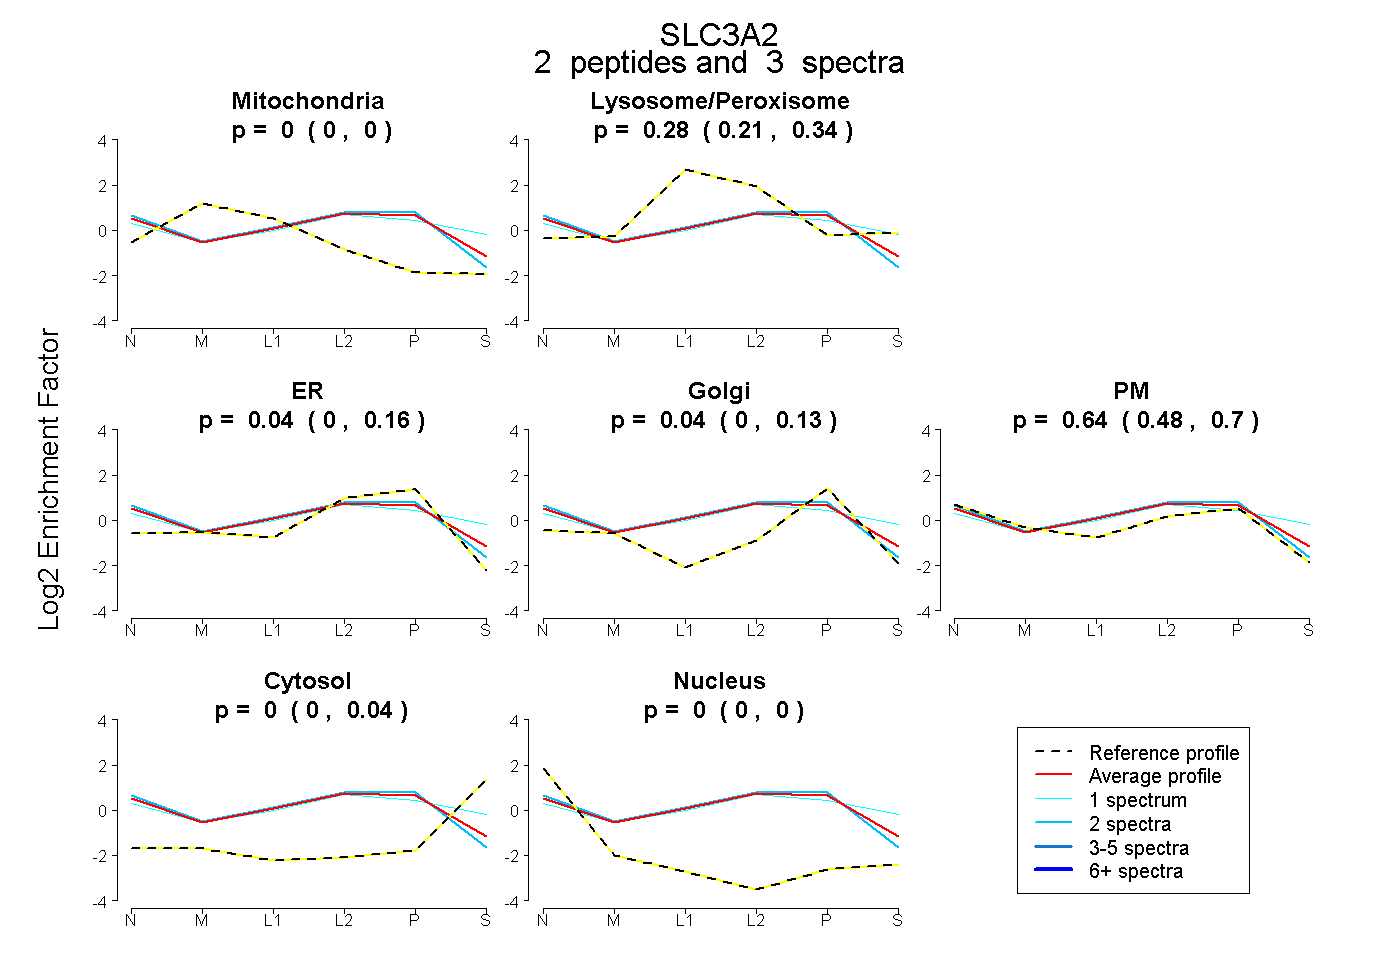
0.000 | 0.000
0.205 | 0.344
0.000 | 0.156
0.000 | 0.133
0.483 | 0.702
0.000 | 0.036
0.000 | 0.000
9peptides
spectra
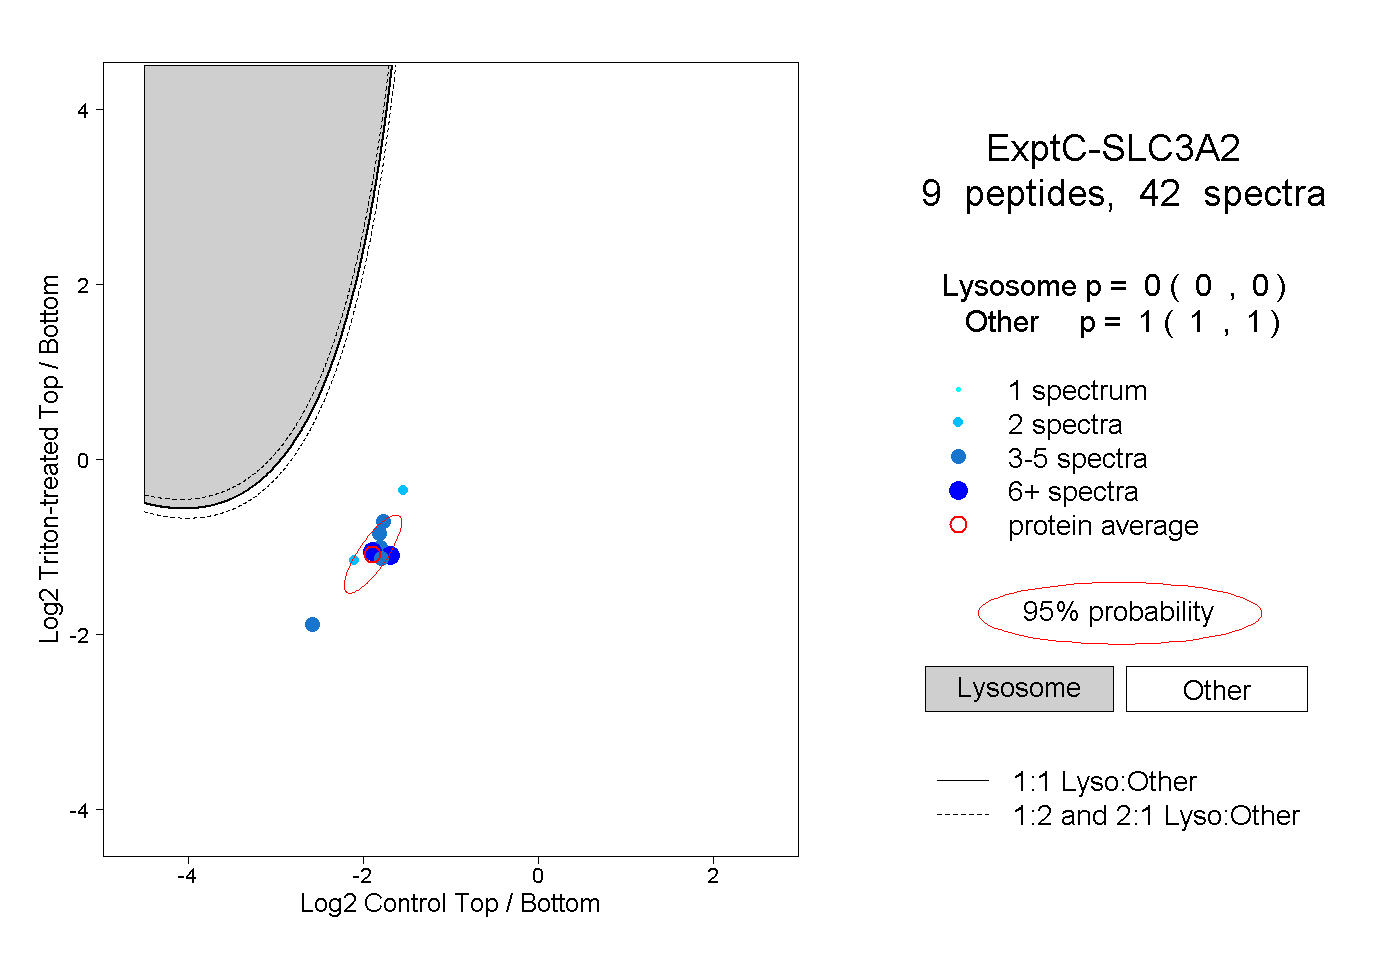
0.000 | 0.000
1.000 | 1.000
4peptides
spectra
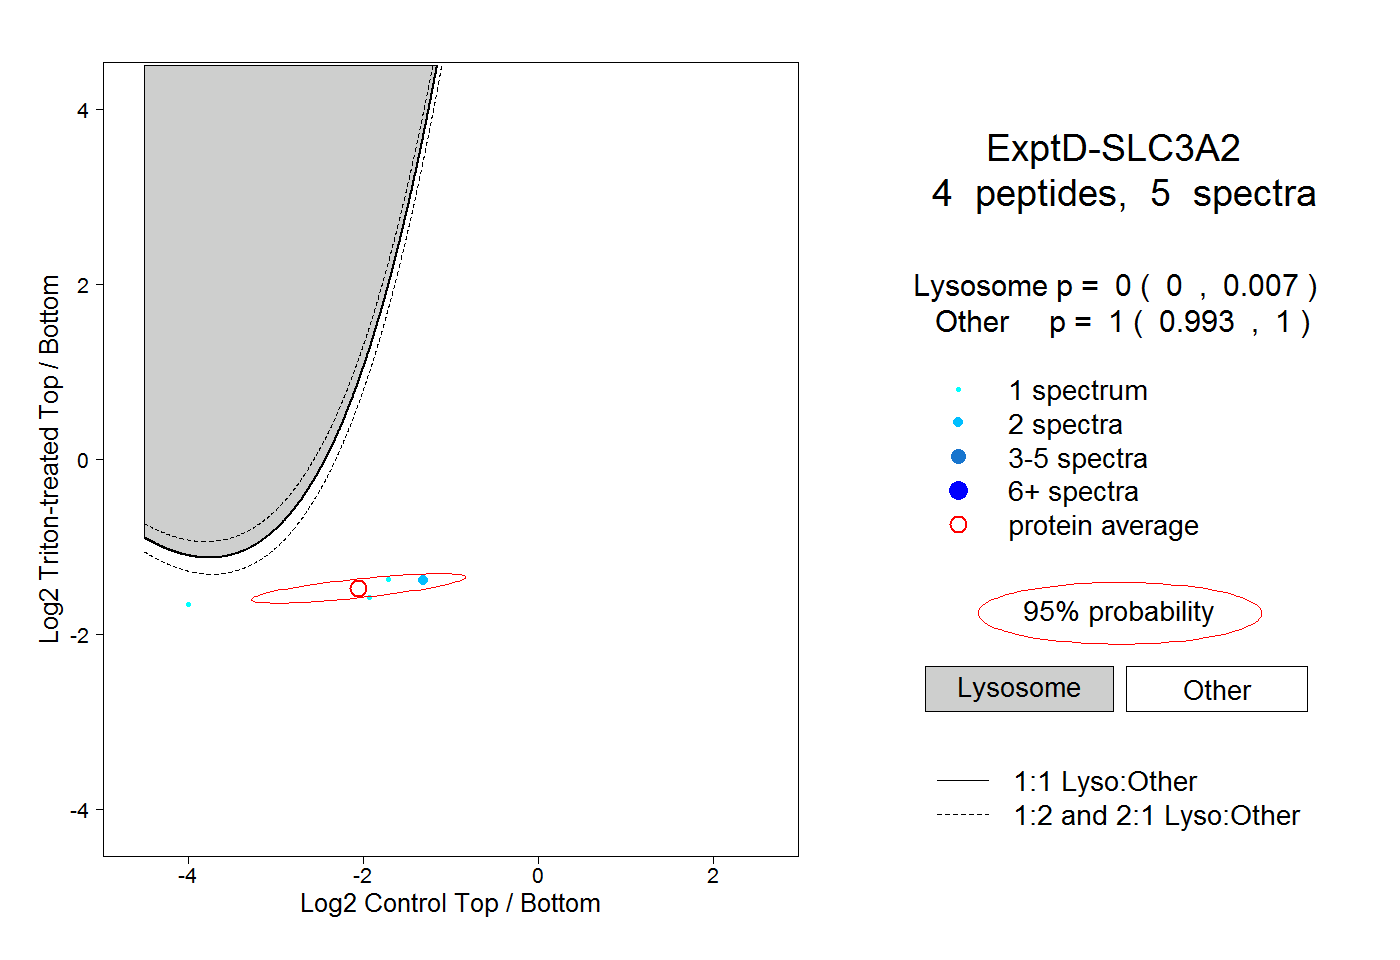
0.000 | 0.007
0.993 | 1.000