 8
8peptides
spectra
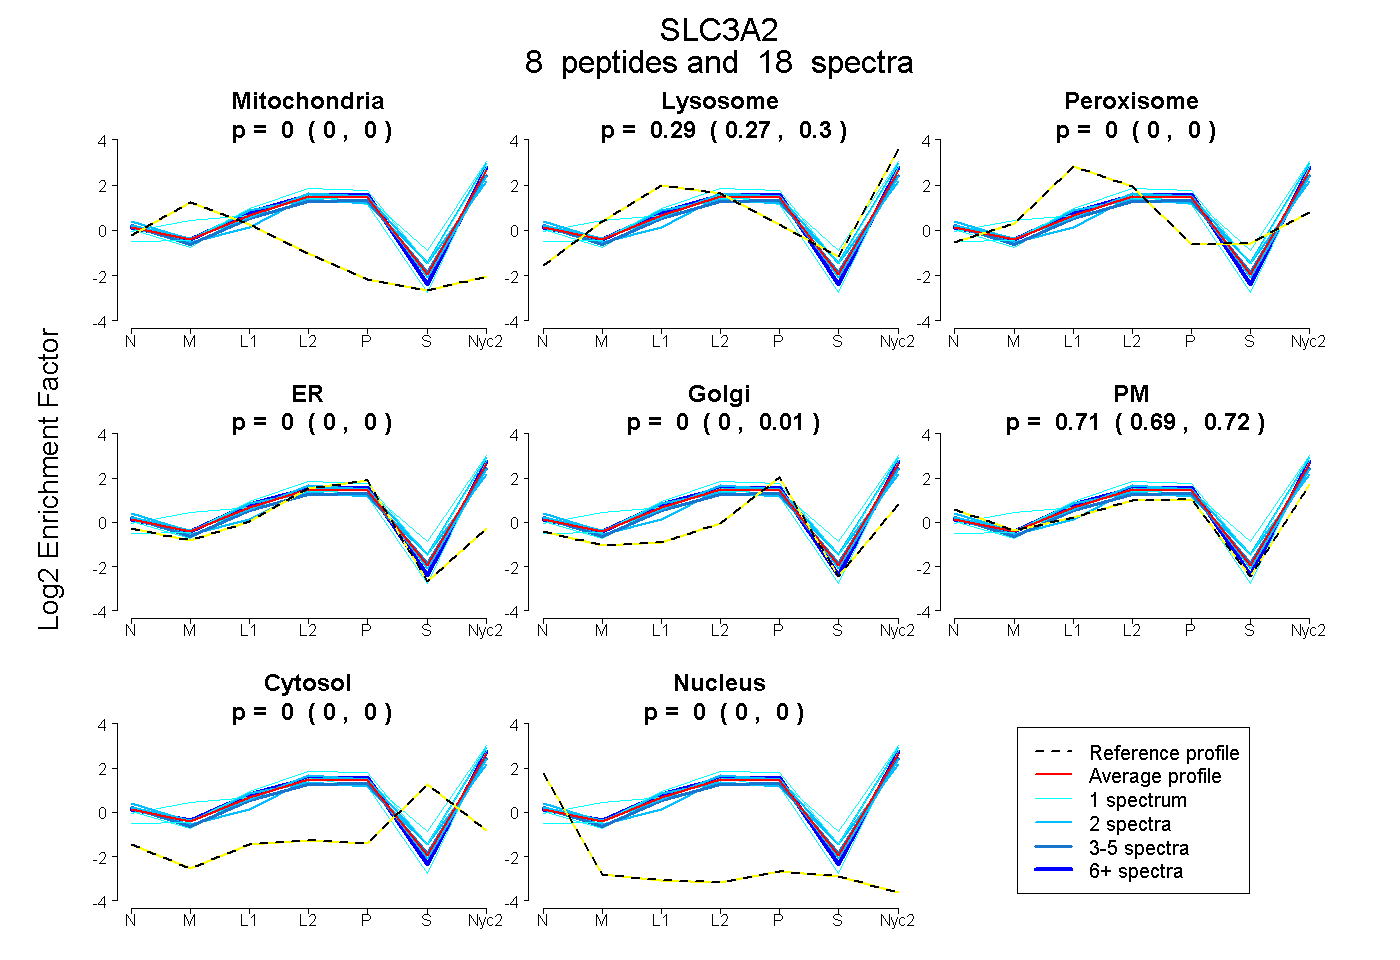
0.000 | 0.000
0.275 | 0.299
0.000 | 0.000
0.000 | 0.000
0.000 | 0.008
0.694 | 0.723
0.000 | 0.000
0.000 | 0.000
| Plot | Mito | Lyso | Perox | ER | Golgi | PM | Cytosol | Nucleus | |||||
| Expt A |
8 peptides |
18 spectra |
|
0.000 0.000 | 0.000 |
0.288 0.275 | 0.299 |
0.000 0.000 | 0.000 |
0.000 0.000 | 0.000 |
0.000 0.000 | 0.008 |
0.712 0.694 | 0.723 |
0.000 0.000 | 0.000 |
0.000 0.000 | 0.000 |
| 2 spectra, QIDPDLGSQEDFK | 0.000 | 0.364 | 0.000 | 0.000 | 0.000 | 0.636 | 0.000 | 0.000 | ||
| 1 spectrum, DEVNETDLK | 0.000 | 0.458 | 0.000 | 0.000 | 0.056 | 0.464 | 0.023 | 0.000 | ||
| 6 spectra, GLVLGPIHK | 0.000 | 0.278 | 0.000 | 0.000 | 0.000 | 0.722 | 0.000 | 0.000 | ||
| 3 spectra, VAEDEAEAGVK | 0.000 | 0.238 | 0.000 | 0.000 | 0.056 | 0.706 | 0.000 | 0.000 | ||
| 1 spectrum, YLVVLNFQDVGLSAR | 0.000 | 0.536 | 0.000 | 0.111 | 0.090 | 0.263 | 0.000 | 0.000 | ||
| 2 spectra, HWDQNER | 0.000 | 0.237 | 0.000 | 0.039 | 0.139 | 0.576 | 0.008 | 0.000 | ||
| 1 spectrum, NFSEDR | 0.000 | 0.324 | 0.000 | 0.000 | 0.000 | 0.676 | 0.000 | 0.000 | ||
| 2 spectra, VAGSPGWVR | 0.000 | 0.232 | 0.000 | 0.046 | 0.000 | 0.722 | 0.000 | 0.000 |
| Plot | Mito | Lyso or Perox | ER | Golgi | PM | Cytosol | Nucleus | ||||||
| Expt B |
2 peptides |
3 spectra |
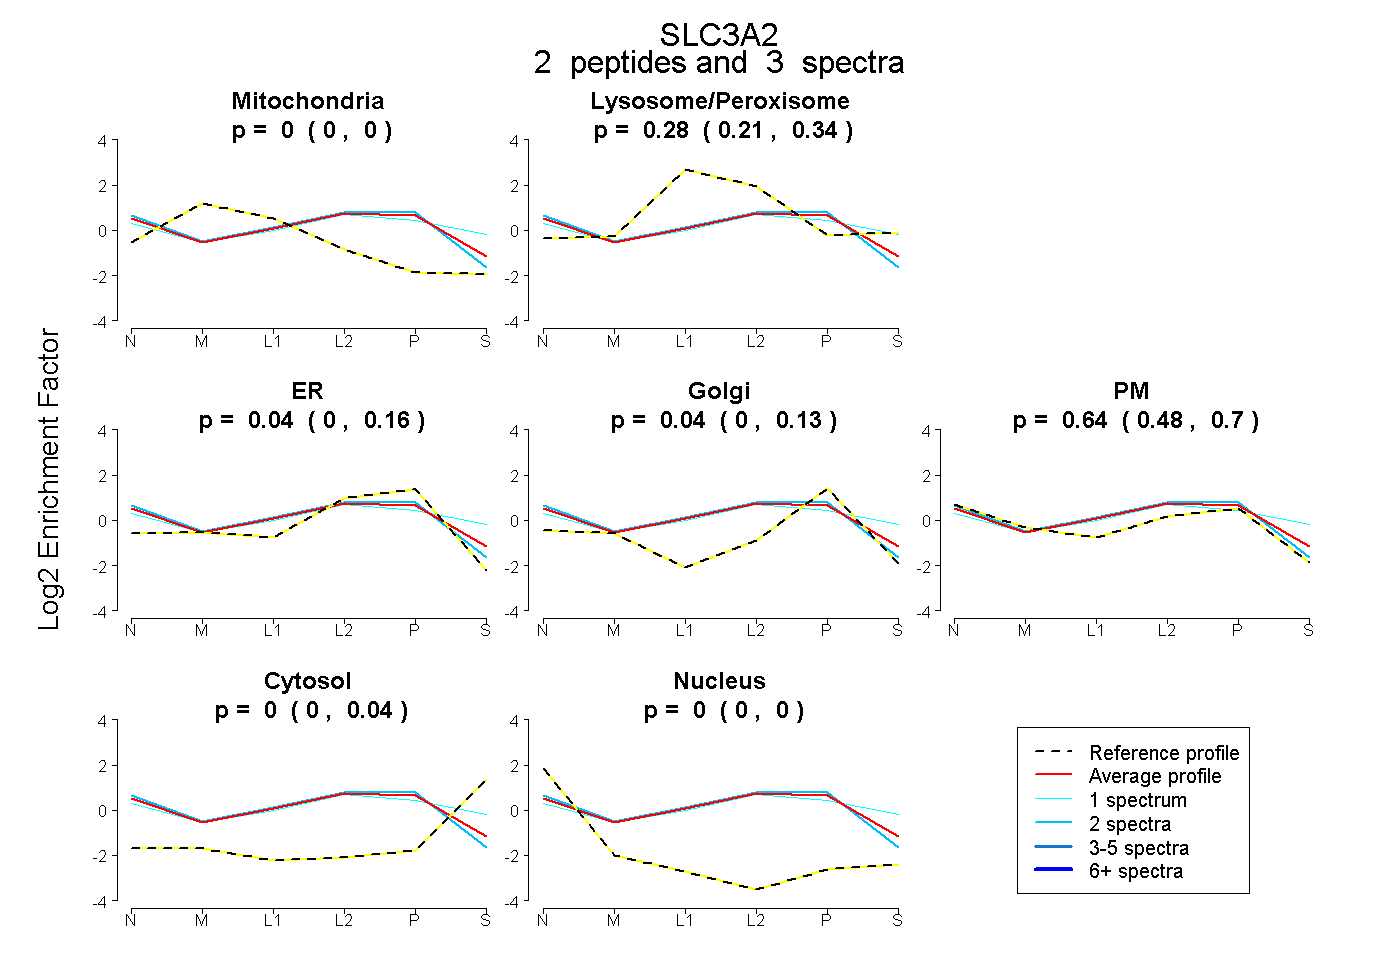 |
0.000 0.000 | 0.000 |
0.281 0.205 | 0.344 |
0.038 0.000 | 0.156 |
0.040 0.000 | 0.133 |
0.641 0.483 | 0.702 |
0.000 0.000 | 0.036 |
0.000 0.000 | 0.000 |
|||
| Plot | Lyso | Other | |||||||||||
| Expt C |
9 peptides |
42 spectra |
 |
0.000 0.000 | 0.000 |
1.000 1.000 | 1.000 |
||||||||
| Plot | Lyso | Other | |||||||||||
| Expt D |
4 peptides |
5 spectra |
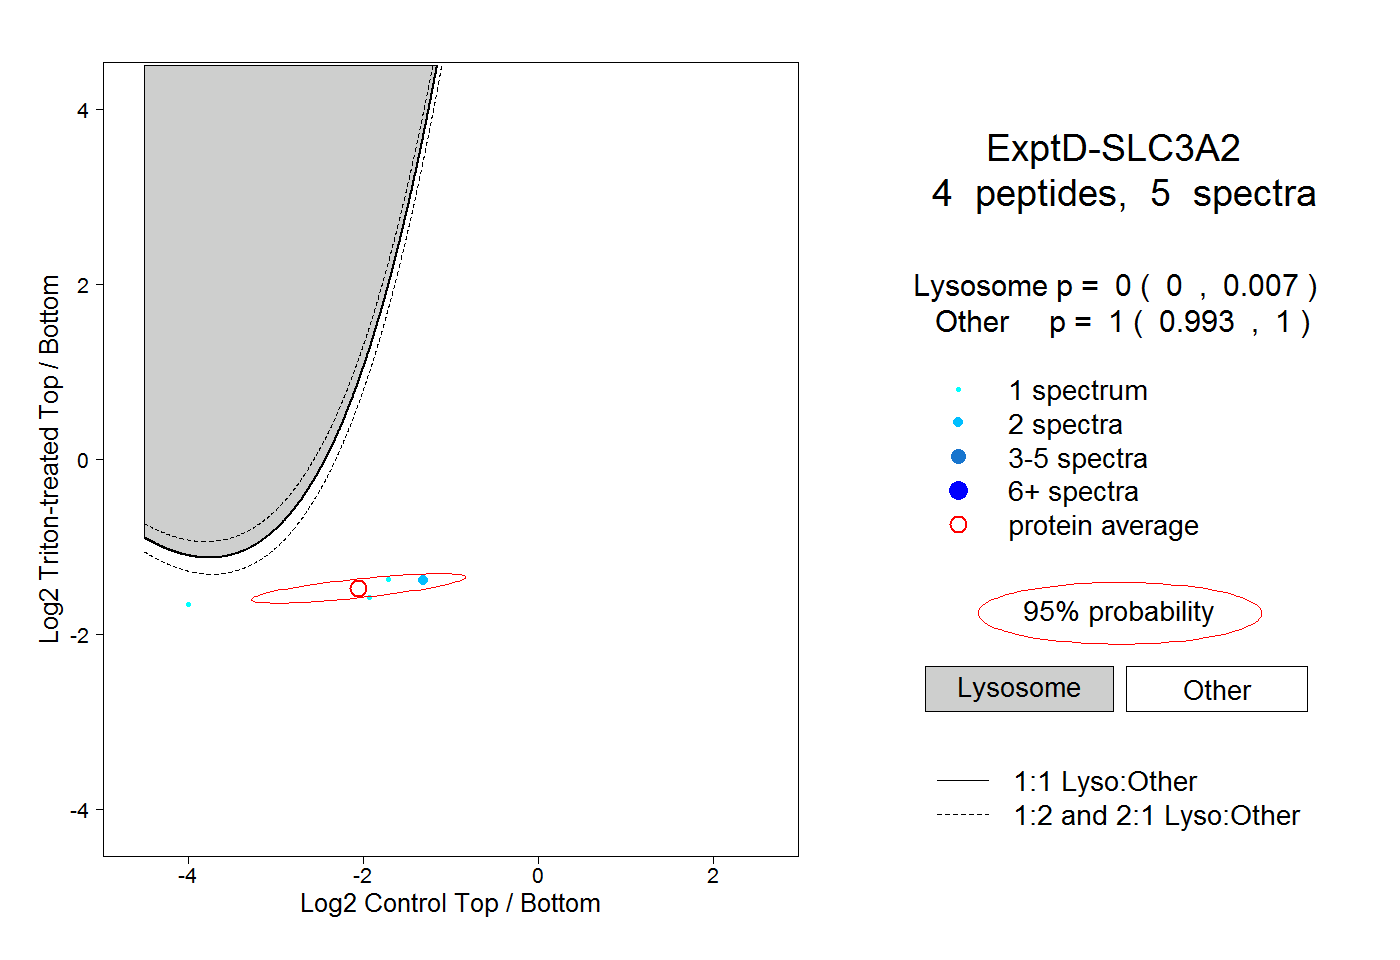 |
0.000 0.000 | 0.007 |
1.000 0.993 | 1.000 |