 6
6peptides
spectra
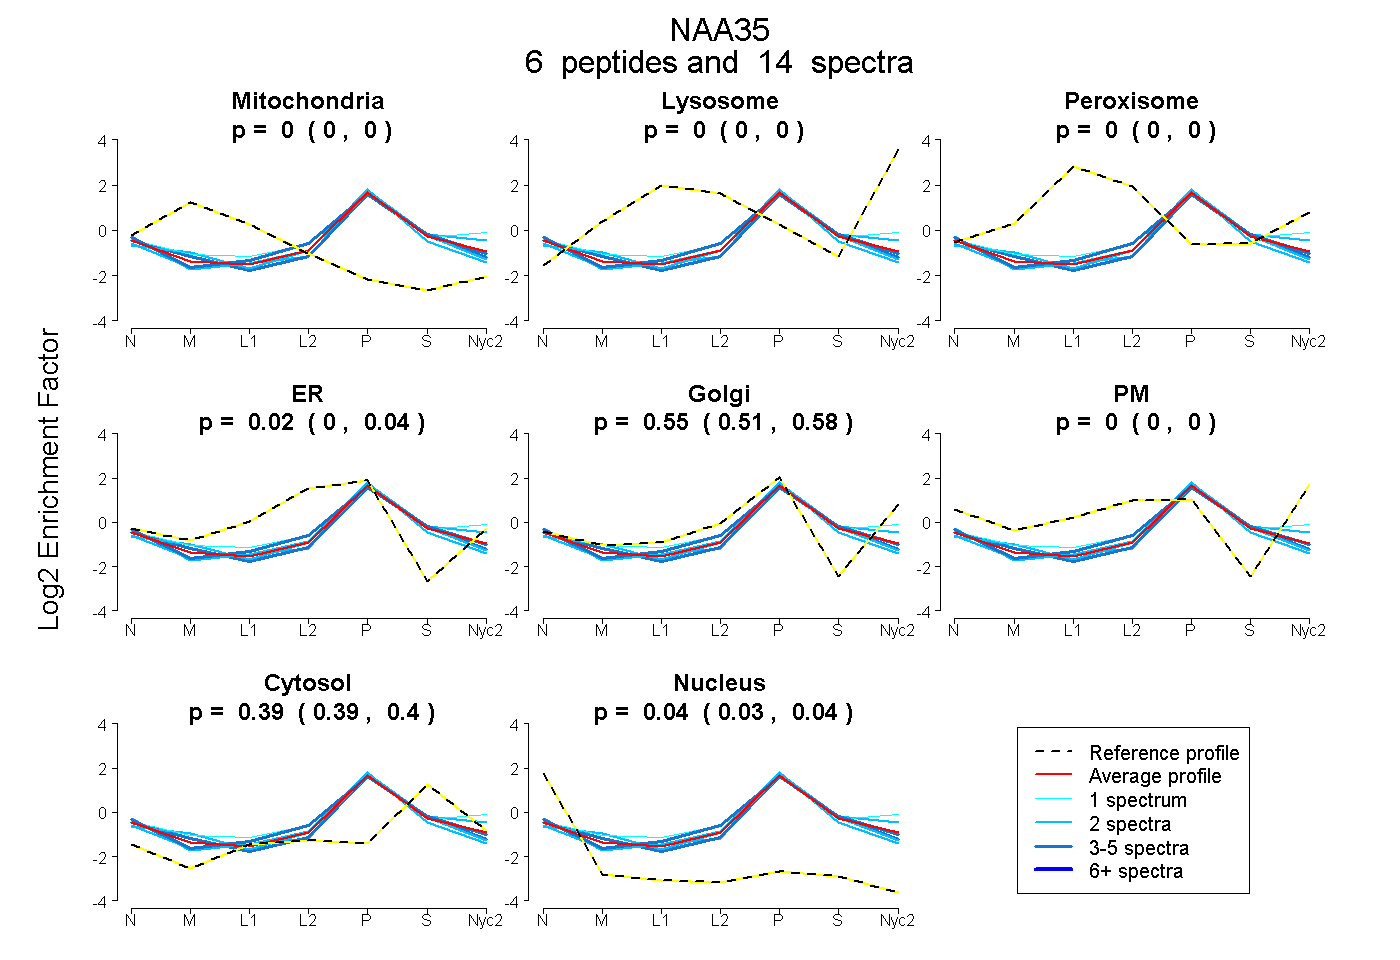
0.000 | 0.000
0.000 | 0.000
0.000 | 0.000
0.000 | 0.045
0.511 | 0.577
0.000 | 0.000
0.389 | 0.399
0.026 | 0.044
3peptides
spectra
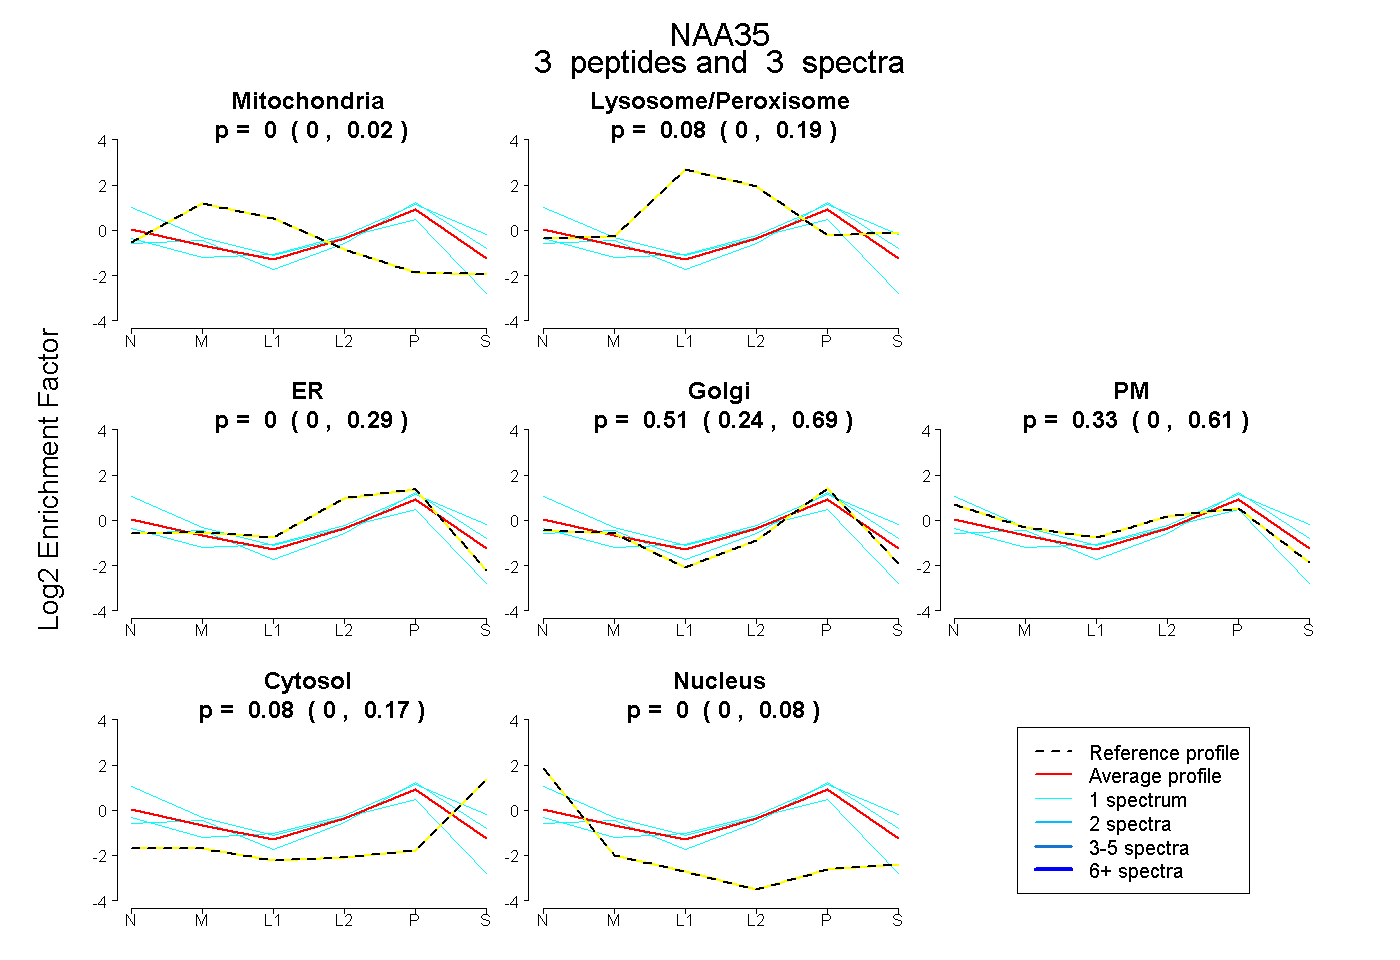
0.000 | 0.017
0.000 | 0.187
0.000 | 0.291
0.241 | 0.695
0.000 | 0.608
0.000 | 0.172
0.000 | 0.081
5peptides
spectra
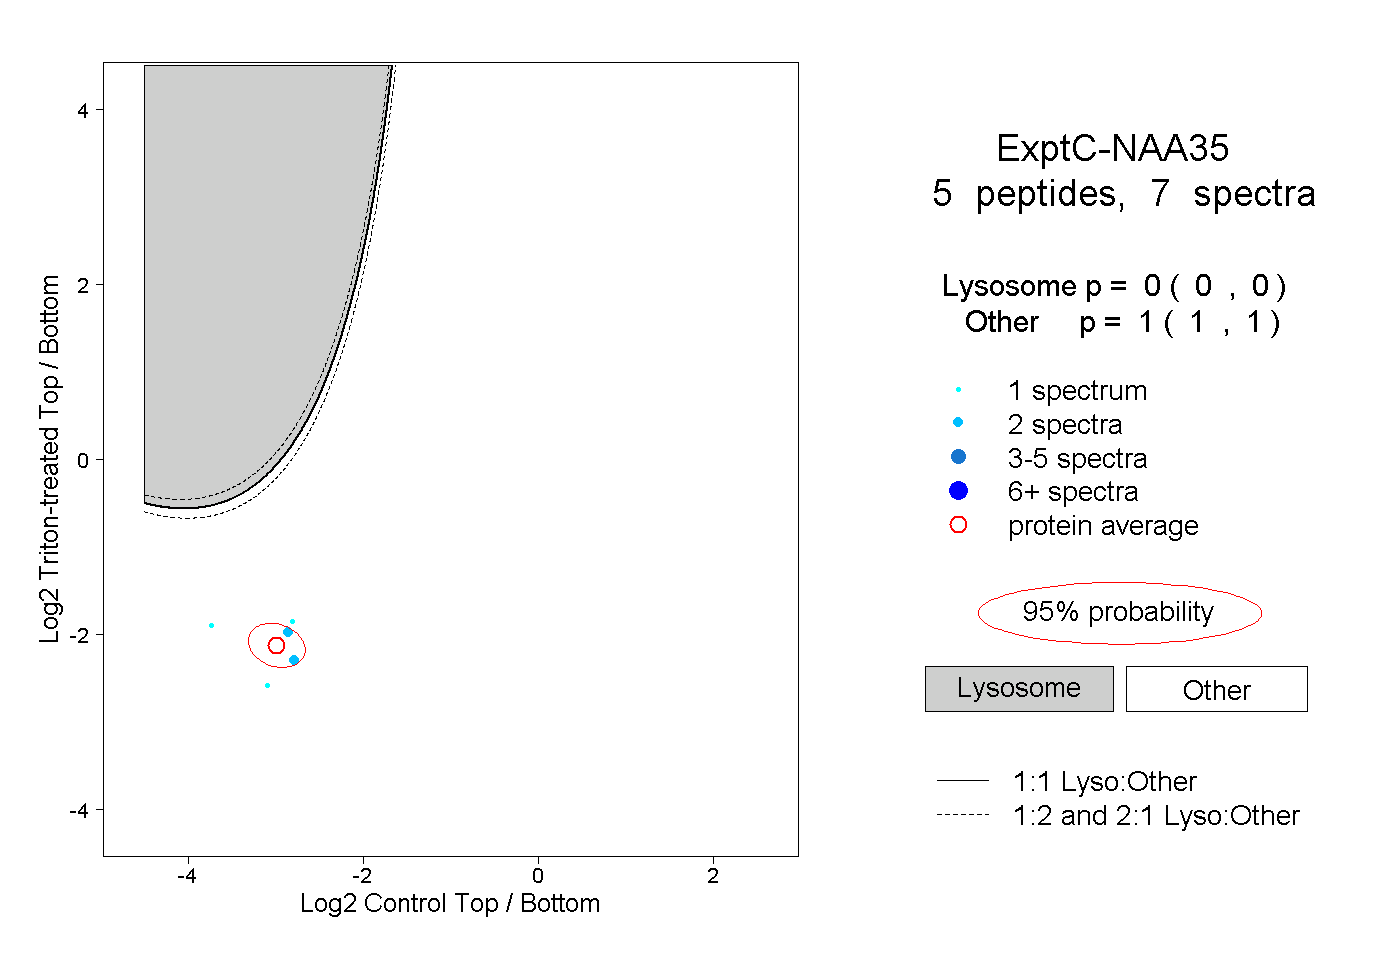
0.000 | 0.000
1.000 | 1.000