NAA35
[ENSRNOP00000025096]
Main page
| | | Plot |
Mito |
Lyso |
|
Perox |
ER |
Golgi |
PM |
Cytosol |
Nucleus |
|
| Expt A |
 6
6
peptides |
14
spectra |
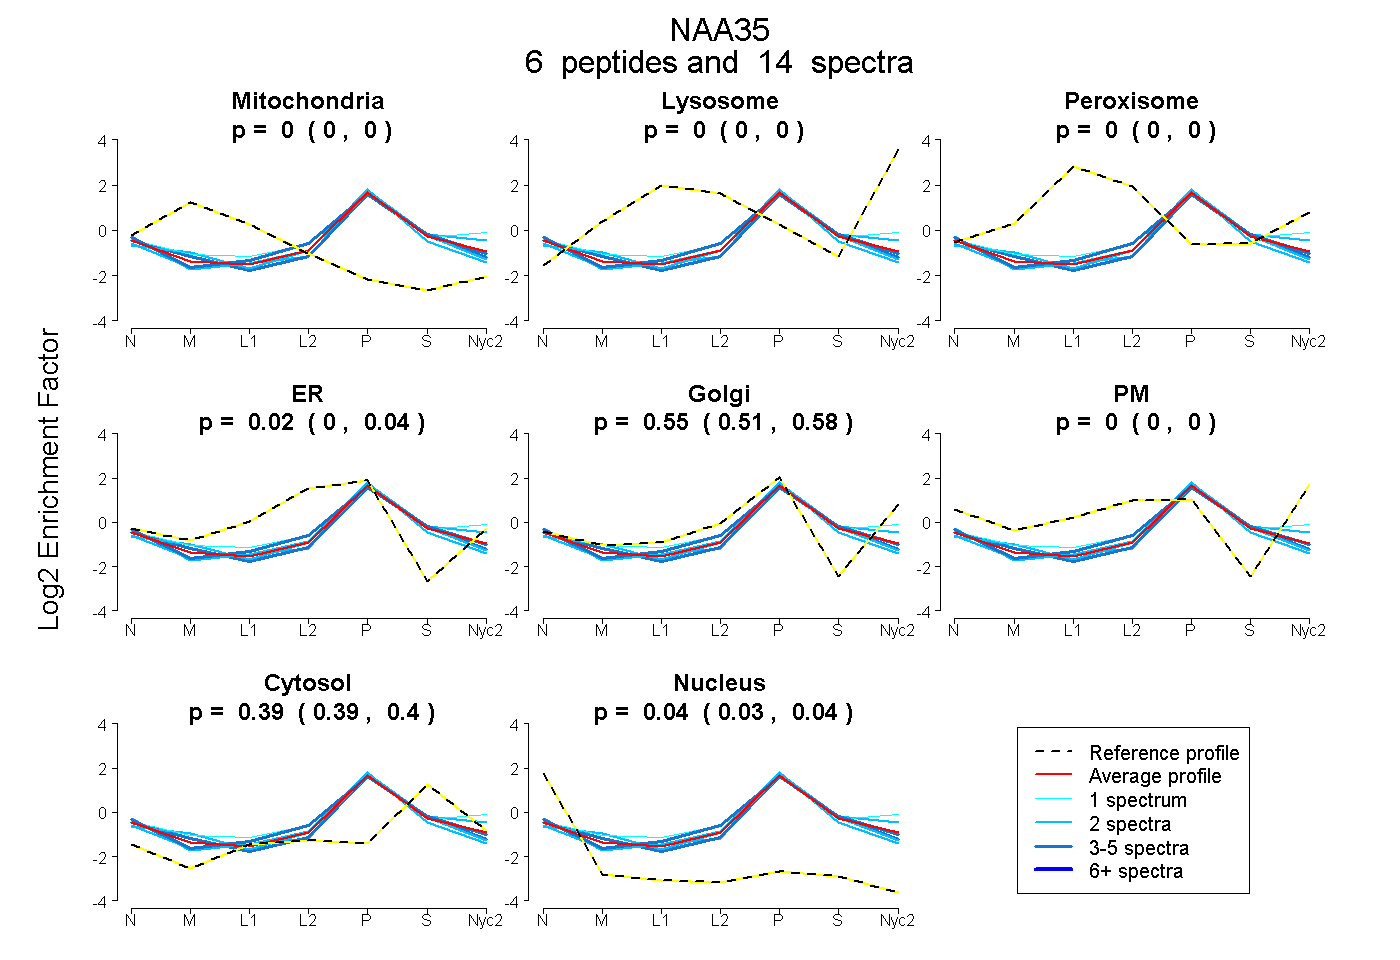 |
0.000
0.000 | 0.000 |
0.000
0.000 | 0.000 |
|
0.000
0.000 | 0.000 |
0.015
0.000 | 0.045 |
0.555
0.511 | 0.577 |
0.000
0.000 | 0.000 |
0.394
0.389 | 0.399 |
0.036
0.026 | 0.044 |
|
| | | Plot |
Mito |
|
Lyso or Perox |
|
ER |
Golgi |
PM |
Cytosol |
Nucleus |
|
| Expt B |
3
peptides |
3
spectra |
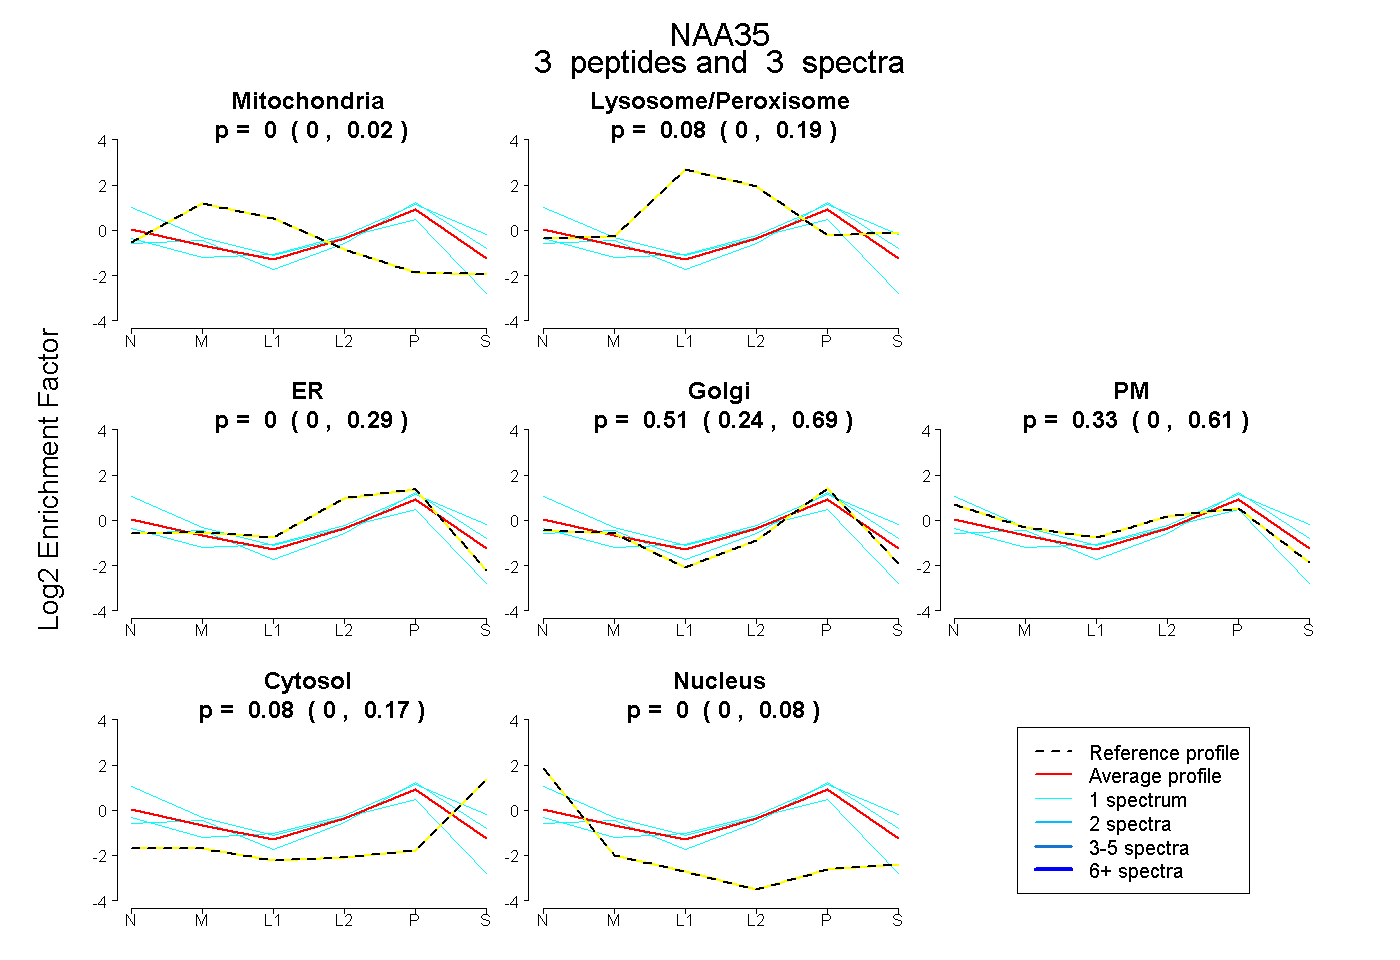 |
0.000
0.000 | 0.017 |
|
0.083
0.000 | 0.187 |
|
0.000
0.000 | 0.291 |
0.506
0.241 | 0.695 |
0.333
0.000 | 0.608 |
0.078
0.000 | 0.172 |
0.000
0.000 | 0.081 |
|
| 1 spectrum, FELDSEQVR |
0.000 |
|
0.113 |
|
0.000 |
0.762 |
0.000 |
0.125 |
0.000 |
|
| 1 spectrum, ICDIAR |
0.000 |
|
0.000 |
|
0.049 |
0.032 |
0.802 |
0.000 |
0.118 |
|
| 1 spectrum, AFALGILK |
0.000 |
|
0.244 |
|
0.000 |
0.572 |
0.000 |
0.184 |
0.000 |
|
| | | Plot |
|
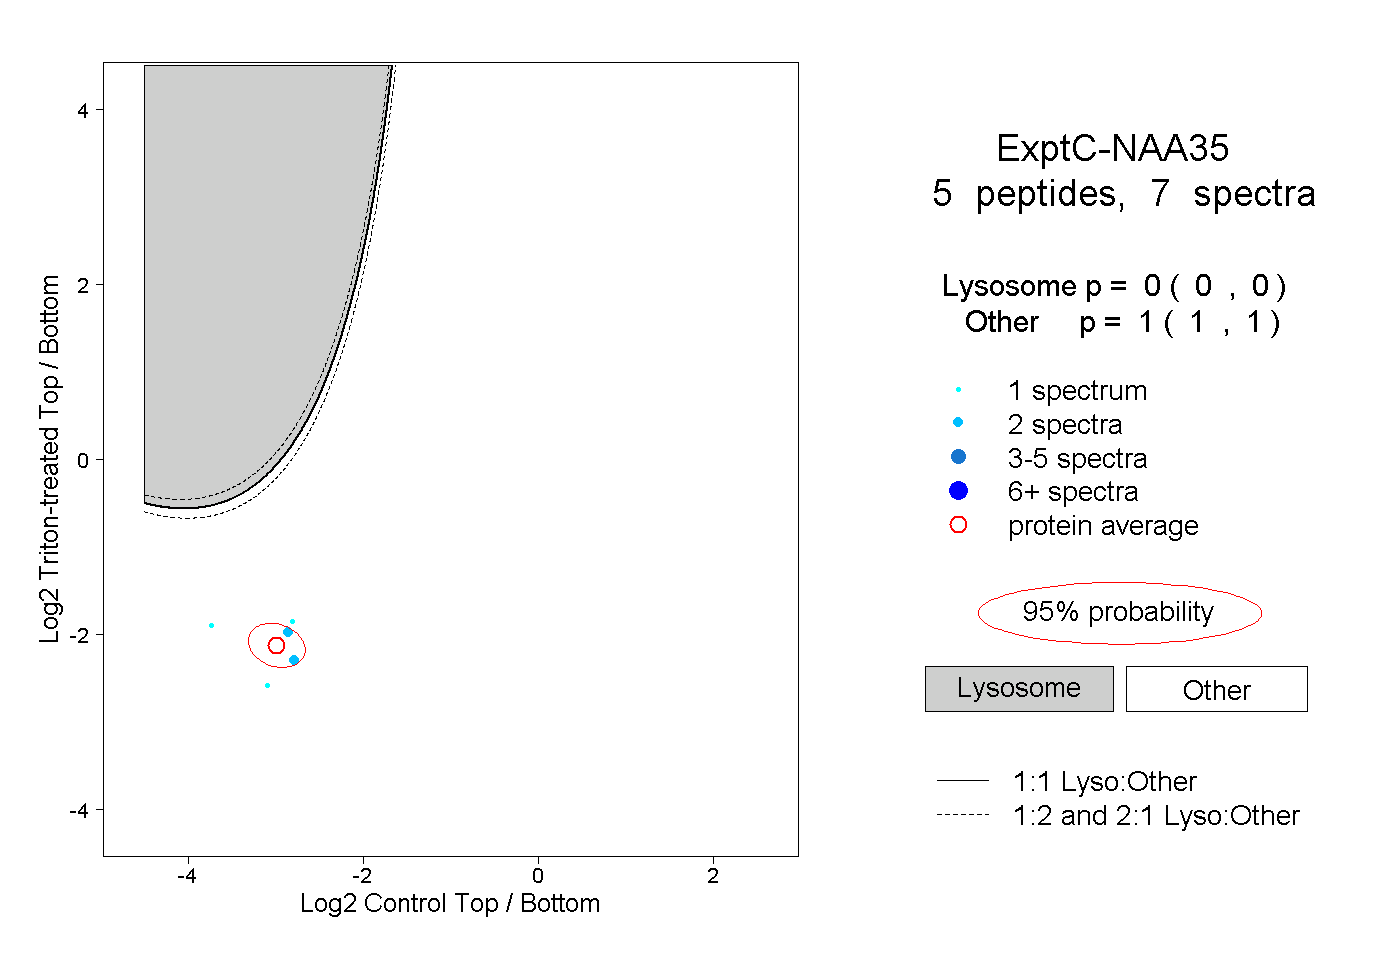
Lyso |
|
|
|
|
|
|
|
Other |
| Expt C |
5
peptides |
7
spectra |
 |
|
0.000
0.000 | 0.000 |
|
|
|
|
|
|
|
1.000
1.000 | 1.000 |