 33
33peptides
spectra
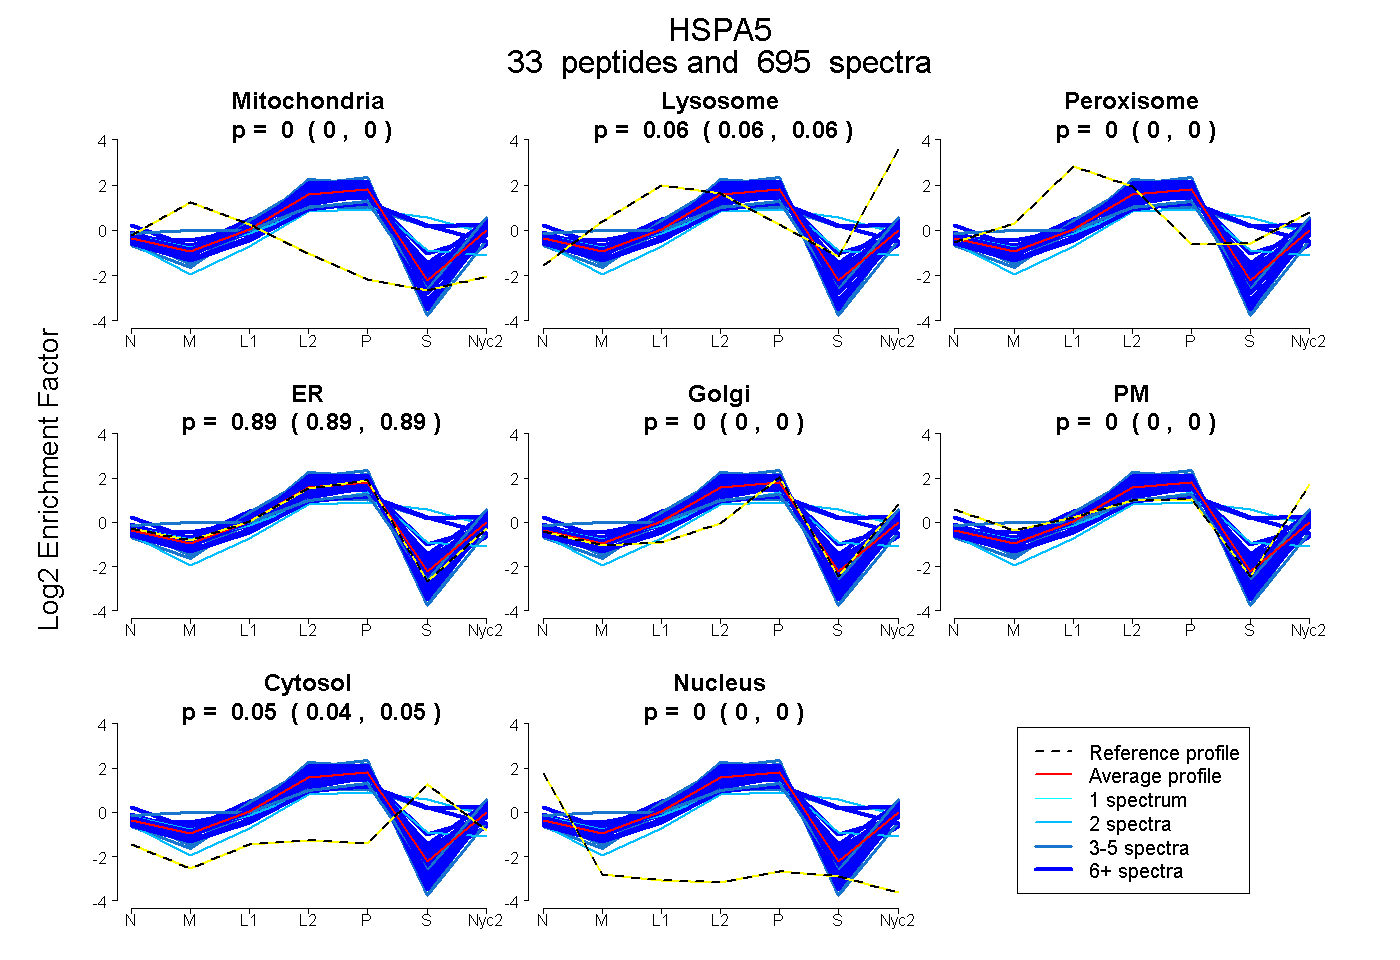
0.000 | 0.000
0.060 | 0.062
0.000 | 0.000
0.891 | 0.895
0.000 | 0.000
0.000 | 0.000
0.044 | 0.047
0.000 | 0.000
32peptides
spectra
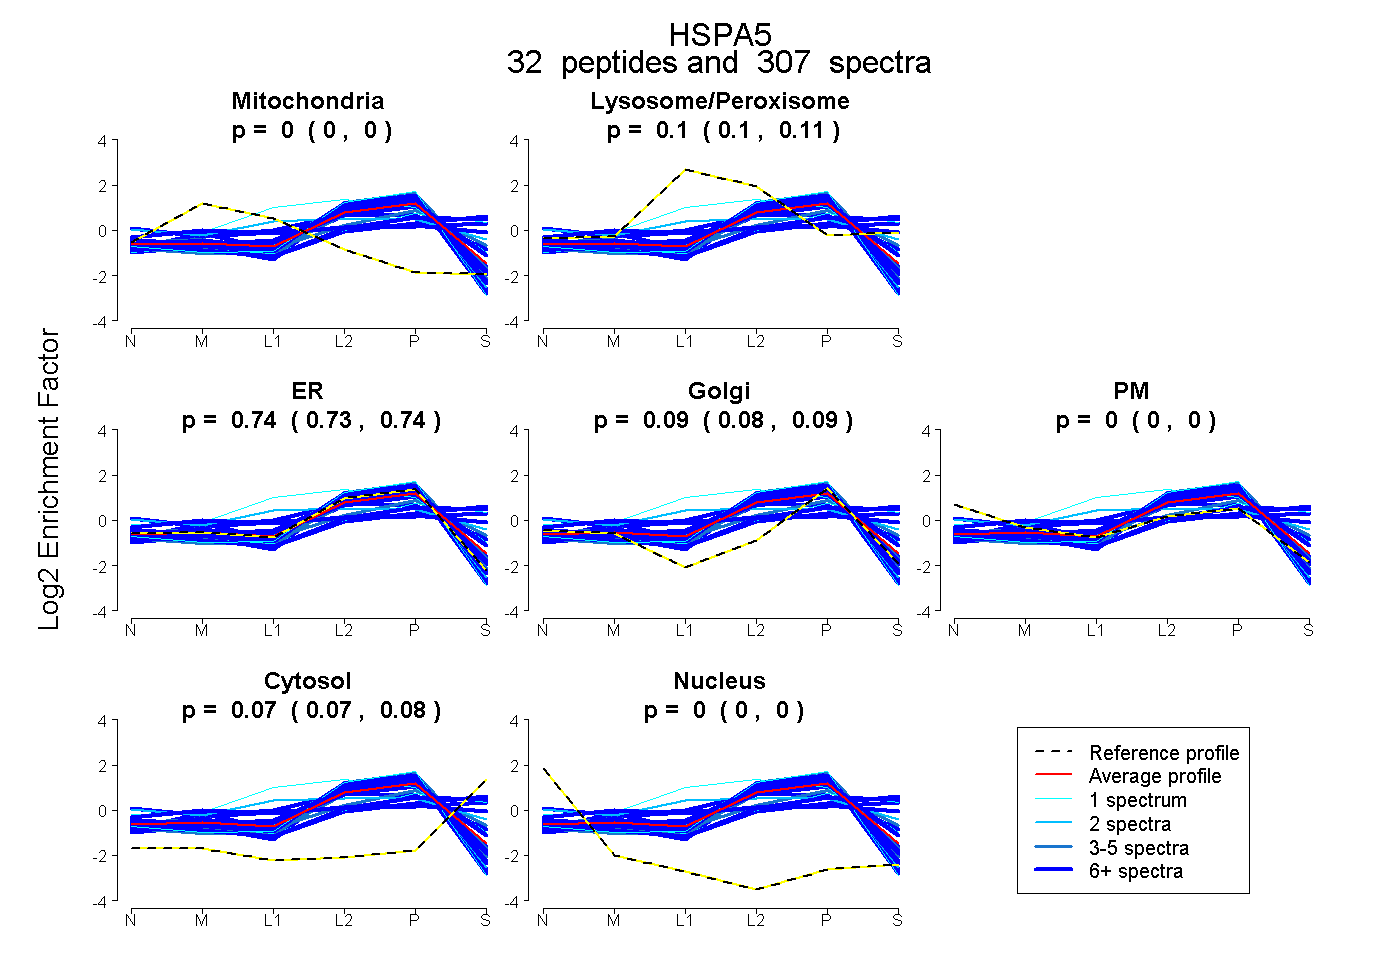
0.000 | 0.000
0.100 | 0.107
0.727 | 0.745
0.078 | 0.091
0.000 | 0.000
0.071 | 0.076
0.000 | 0.000
34peptides
spectra
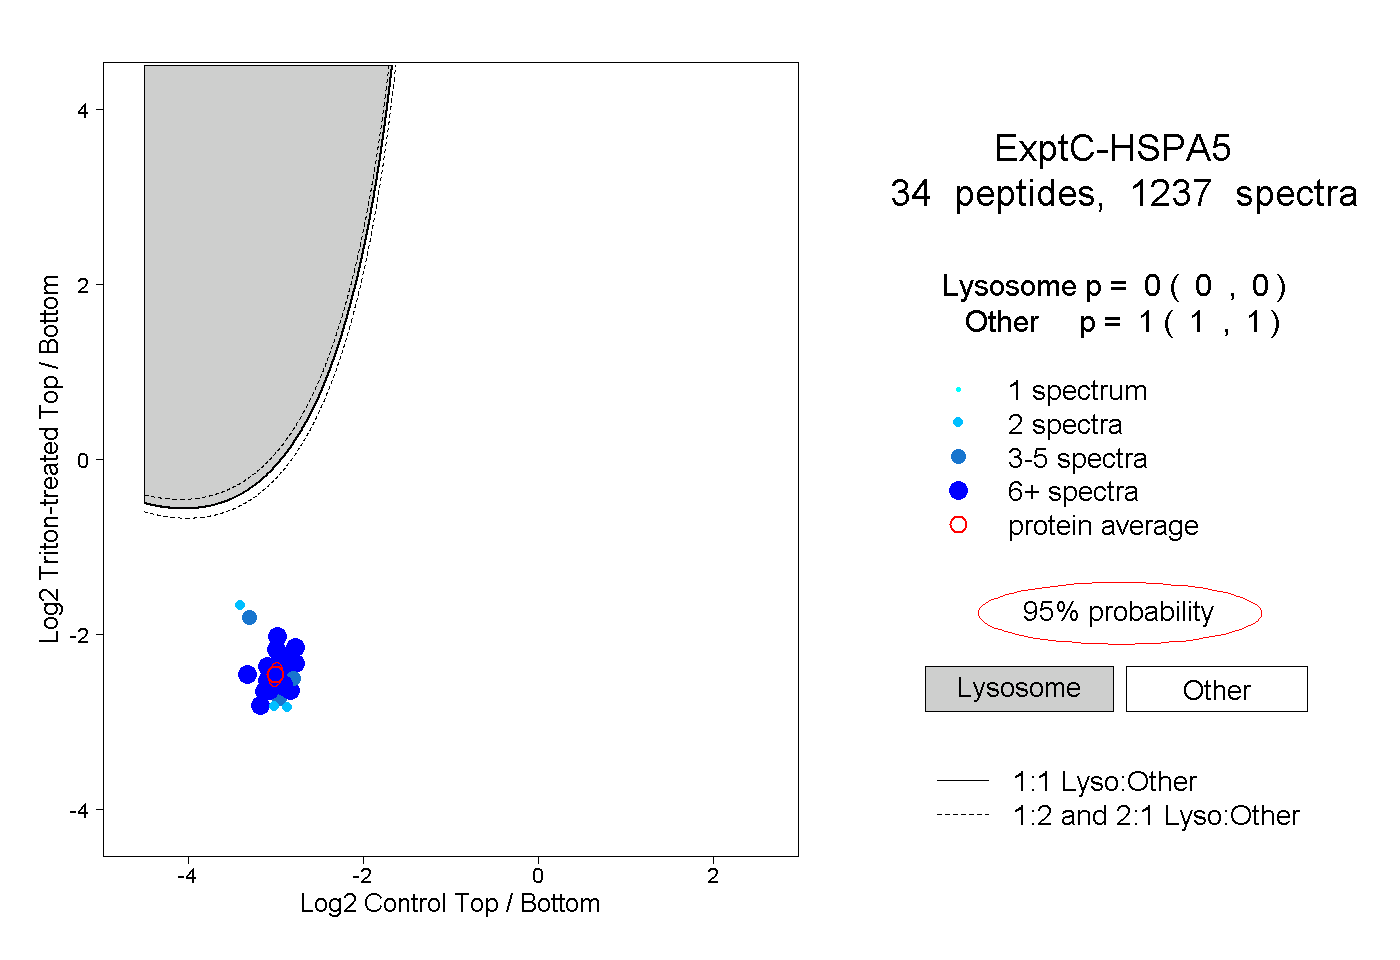
0.000 | 0.000
1.000 | 1.000
29peptides
spectra
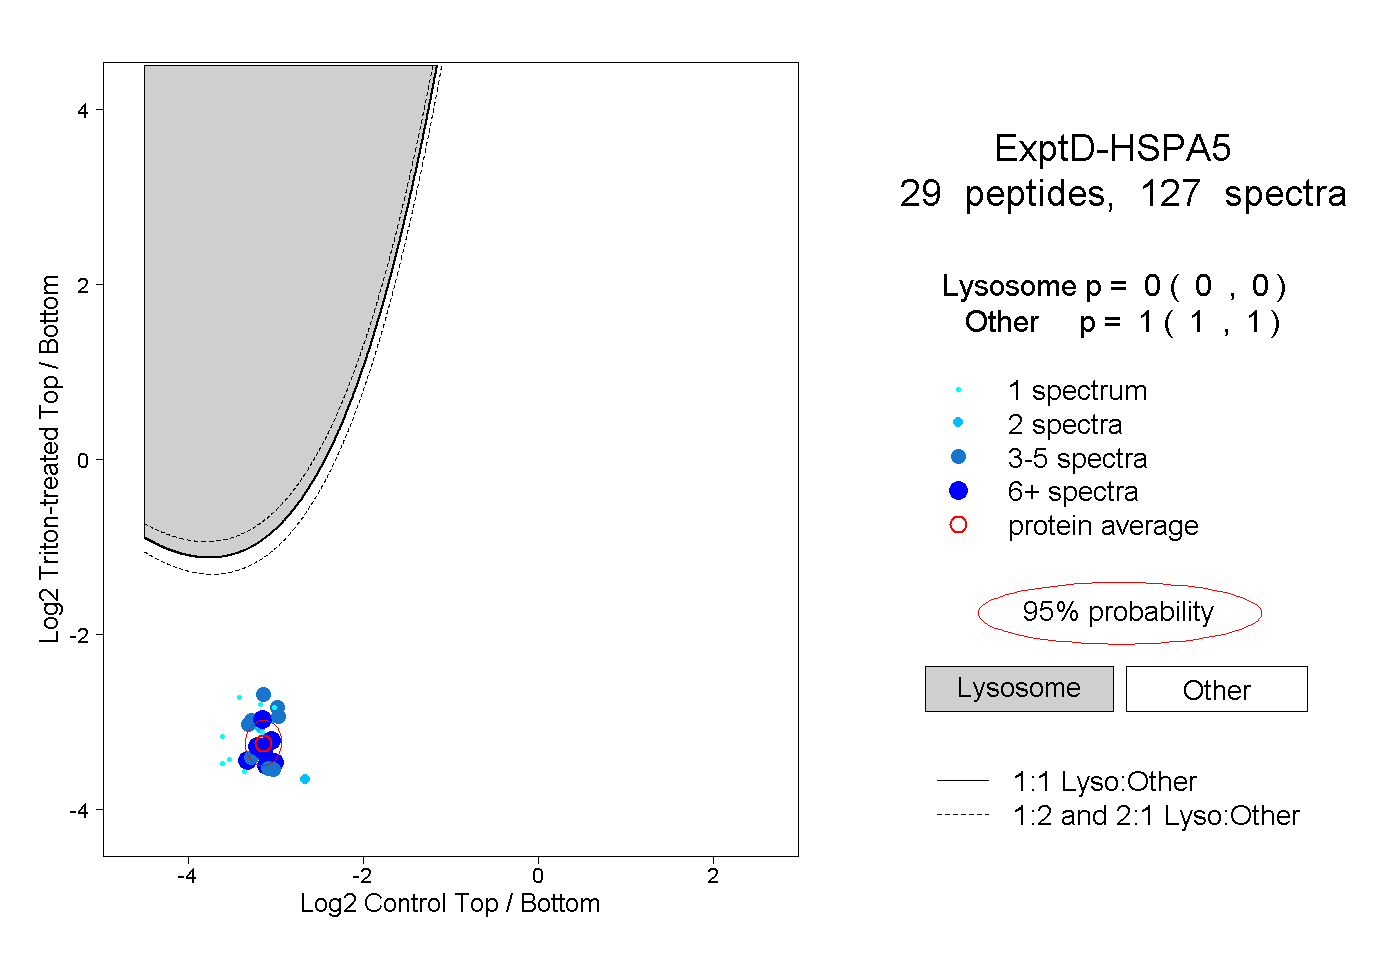
0.000 | 0.000
1.000 | 1.000