 12
12peptides
spectra
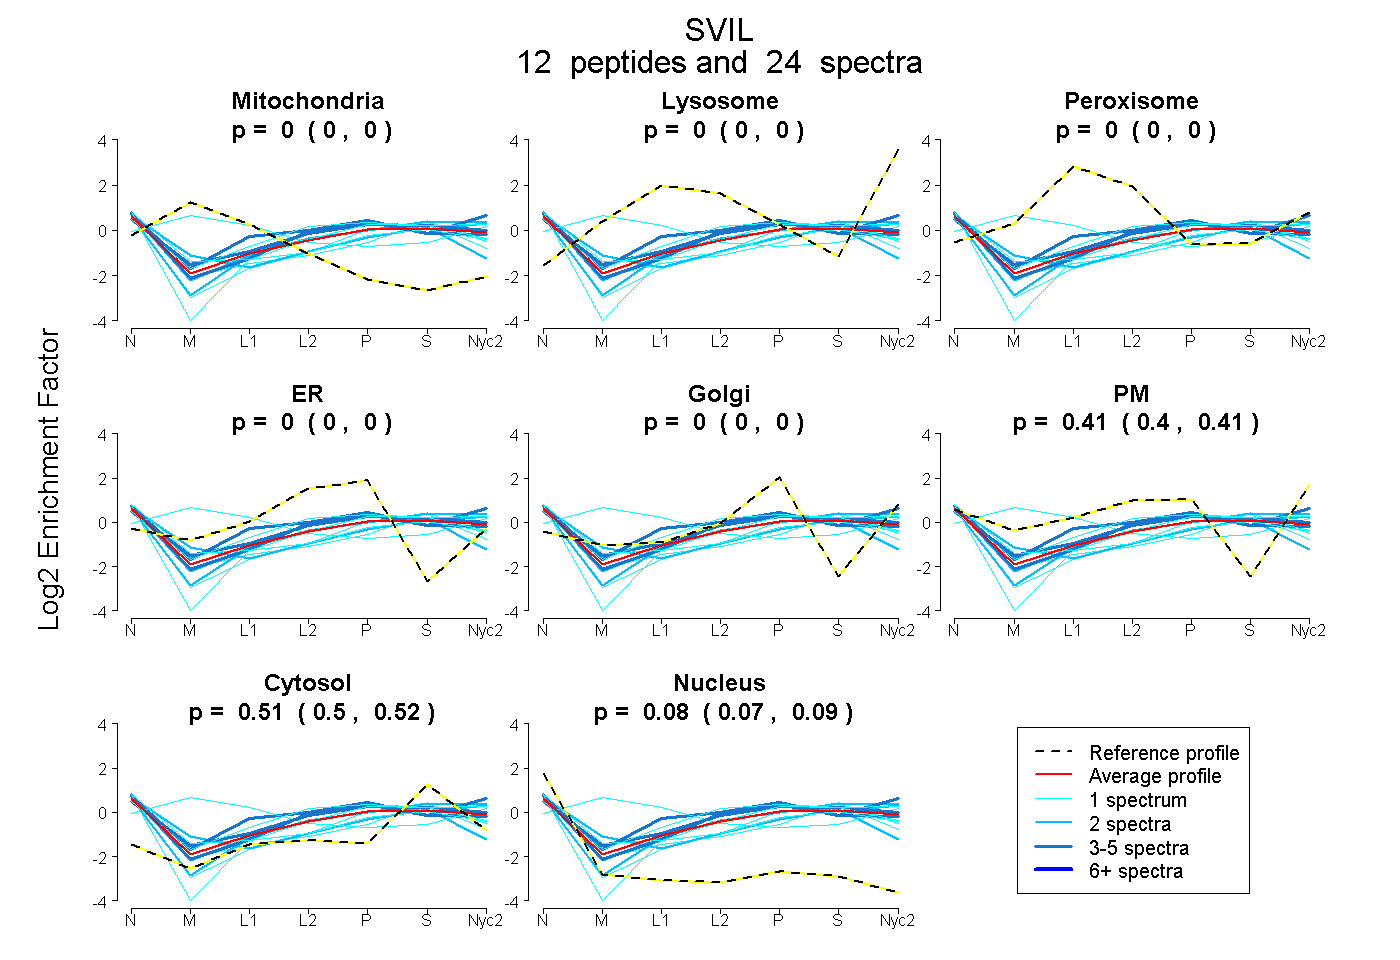
0.000 | 0.000
0.000 | 0.000
0.000 | 0.000
0.000 | 0.000
0.000 | 0.000
0.398 | 0.415
0.504 | 0.518
0.074 | 0.087
1peptide
spectrum
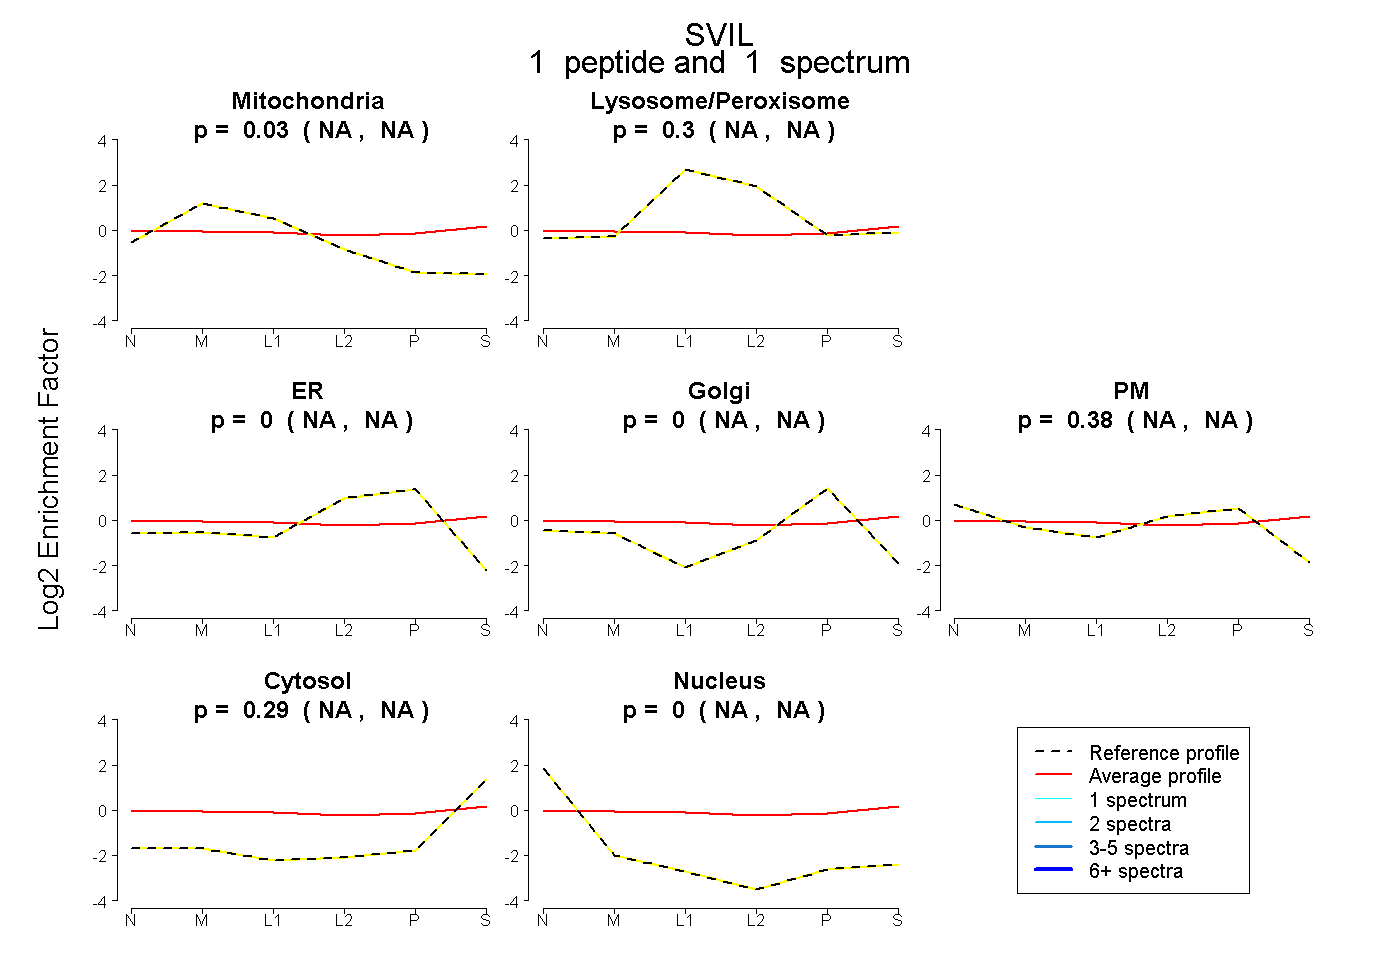
NA | NA
NA | NA
NA | NA
NA | NA
NA | NA
NA | NA
NA | NA
13peptides
spectra

0.000 | 1.000
0.000 | 1.000
1peptide
spectra
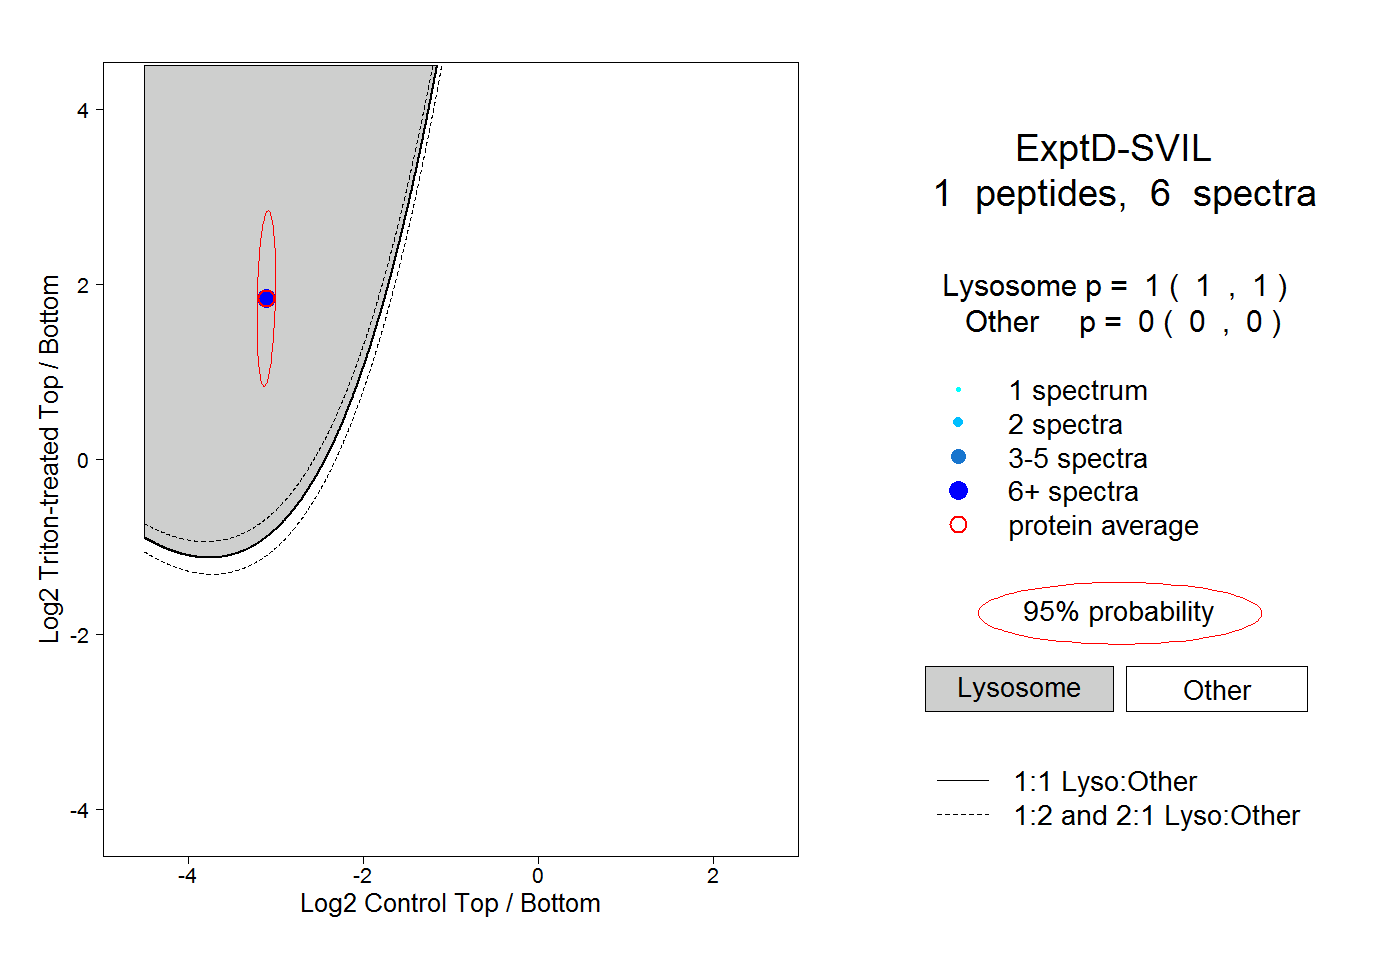
1.000 | 1.000
0.000 | 0.000