 12
12peptides
spectra
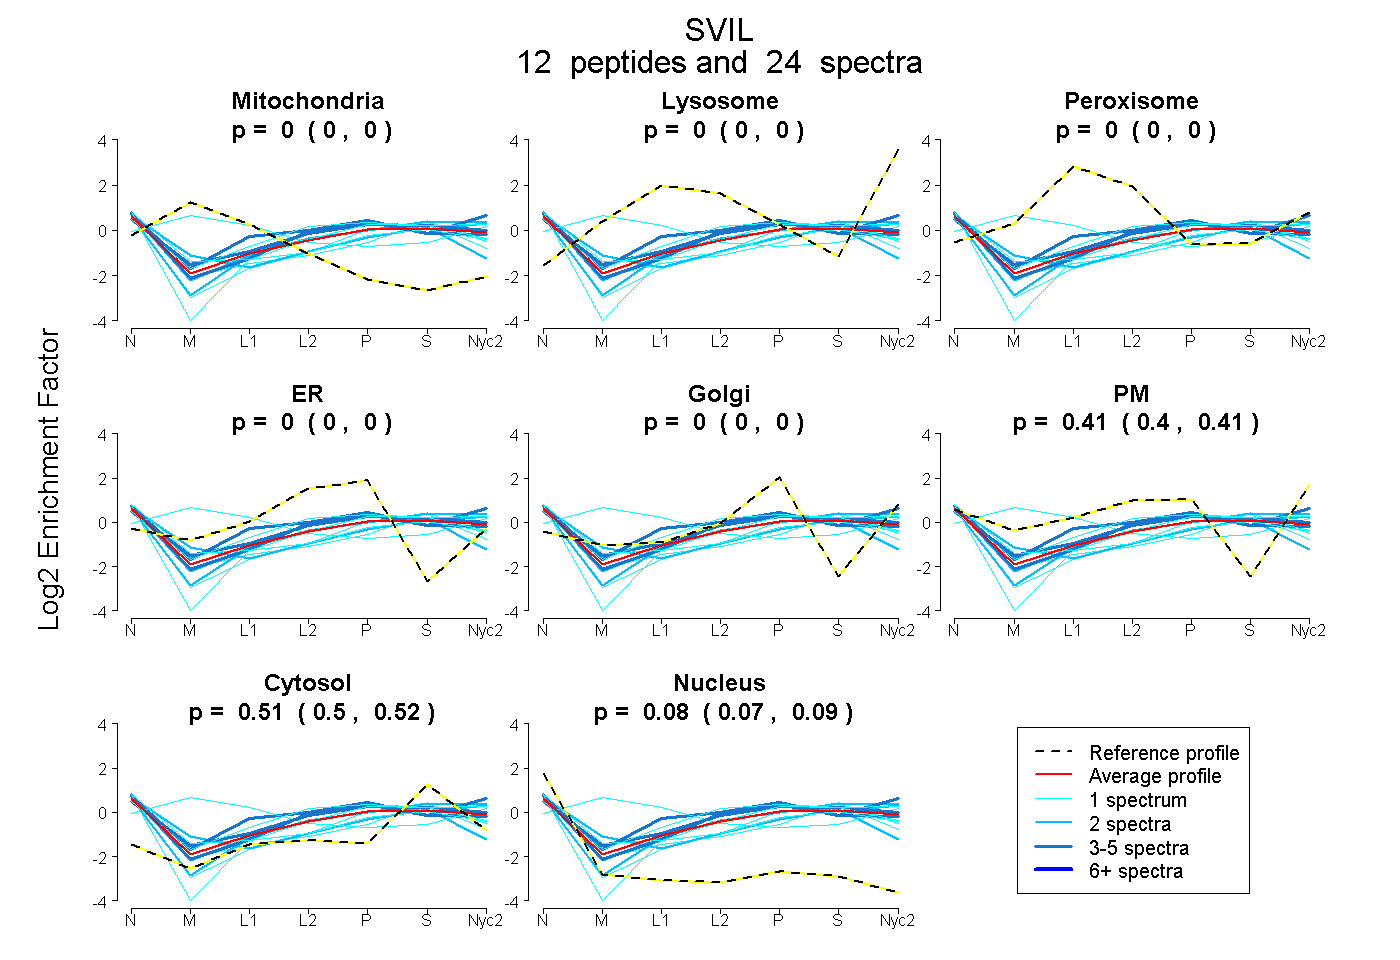
0.000 | 0.000
0.000 | 0.000
0.000 | 0.000
0.000 | 0.000
0.000 | 0.000
0.398 | 0.415
0.504 | 0.518
0.074 | 0.087
| Plot | Mito | Lyso | Perox | ER | Golgi | PM | Cytosol | Nucleus | |||||
| Expt A |
12 peptides |
24 spectra |
|
0.000 0.000 | 0.000 |
0.000 0.000 | 0.000 |
0.000 0.000 | 0.000 |
0.000 0.000 | 0.000 |
0.000 0.000 | 0.000 |
0.407 0.398 | 0.415 |
0.512 0.504 | 0.518 |
0.081 0.074 | 0.087 |
| 5 spectra, LDDDETFAK | 0.000 | 0.000 | 0.000 | 0.102 | 0.024 | 0.338 | 0.446 | 0.090 | ||
| 1 spectrum, ENFSSISLR | 0.000 | 0.000 | 0.000 | 0.000 | 0.000 | 0.260 | 0.582 | 0.158 | ||
| 2 spectra, IALFNK | 0.000 | 0.000 | 0.000 | 0.000 | 0.000 | 0.363 | 0.602 | 0.035 | ||
| 3 spectra, LALLK | 0.000 | 0.000 | 0.000 | 0.000 | 0.000 | 0.572 | 0.428 | 0.000 | ||
| 1 spectrum, STSFSEVPR | 0.000 | 0.000 | 0.000 | 0.020 | 0.000 | 0.475 | 0.505 | 0.000 | ||
| 2 spectra, HLITVR | 0.000 | 0.000 | 0.000 | 0.000 | 0.033 | 0.437 | 0.489 | 0.041 | ||
| 4 spectra, SGEEDWK | 0.000 | 0.000 | 0.000 | 0.026 | 0.000 | 0.432 | 0.521 | 0.021 | ||
| 1 spectrum, LLEEDTPR | 0.367 | 0.174 | 0.068 | 0.000 | 0.000 | 0.157 | 0.235 | 0.000 | ||
| 2 spectra, FLDWTELK | 0.024 | 0.000 | 0.000 | 0.075 | 0.000 | 0.216 | 0.484 | 0.202 | ||
| 1 spectrum, YMASTAVGSR | 0.000 | 0.000 | 0.000 | 0.000 | 0.000 | 0.366 | 0.475 | 0.159 | ||
| 1 spectrum, DDLLQEYTEQR | 0.000 | 0.000 | 0.000 | 0.000 | 0.221 | 0.053 | 0.565 | 0.160 | ||
| 1 spectrum, SPSPVENSDSPVR | 0.000 | 0.000 | 0.000 | 0.059 | 0.169 | 0.091 | 0.574 | 0.107 |
| Plot | Mito | Lyso or Perox | ER | Golgi | PM | Cytosol | Nucleus | ||||||
| Expt B |
1 peptide |
1 spectrum |
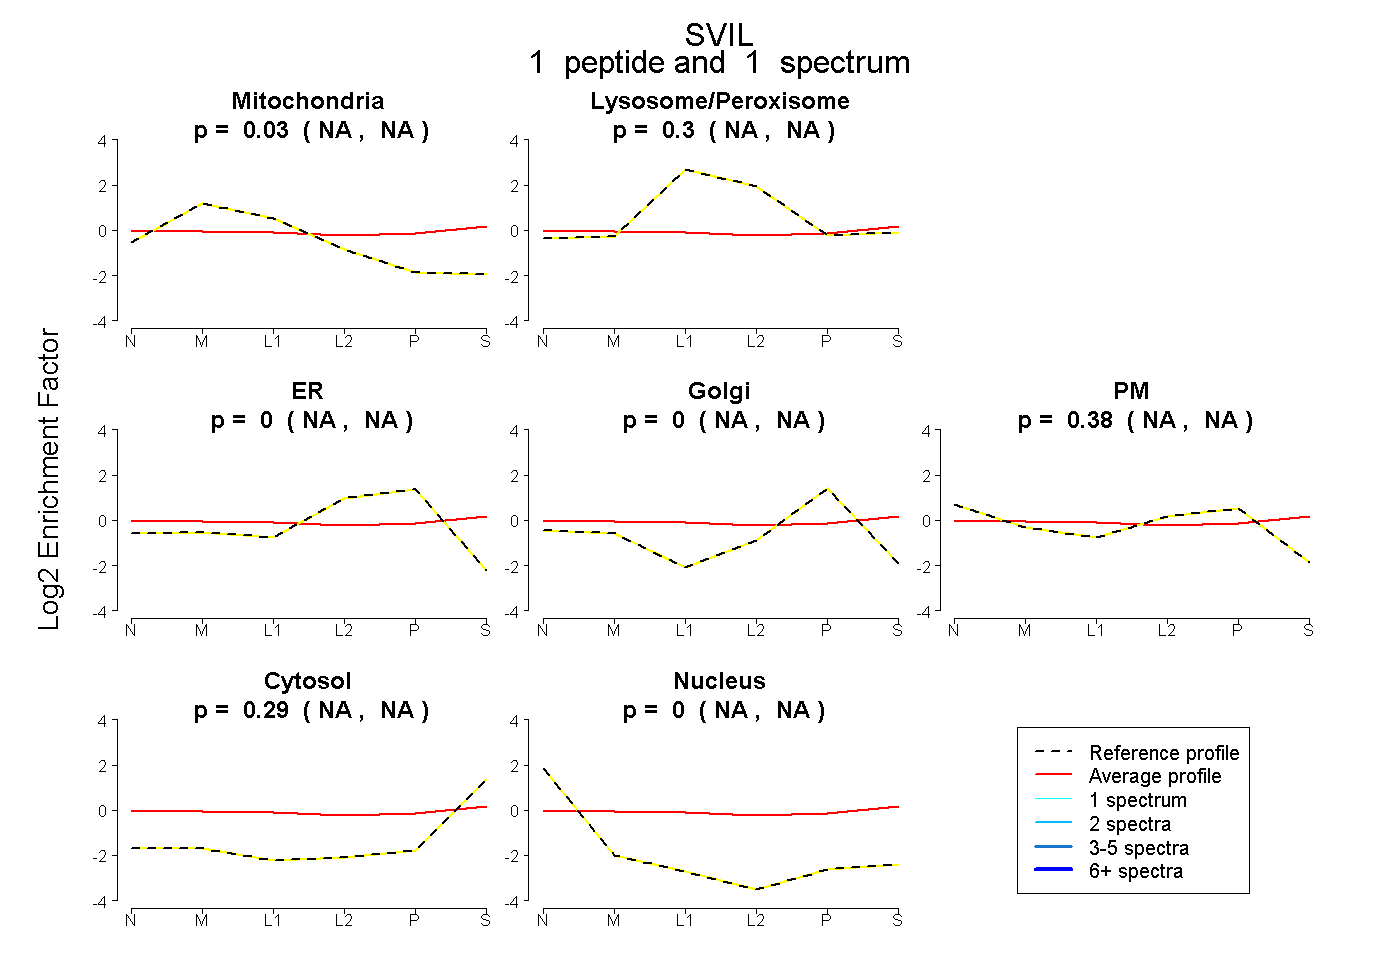 |
0.027 NA | NA |
0.303 NA | NA |
0.000 NA | NA |
0.000 NA | NA |
0.379 NA | NA |
0.292 NA | NA |
0.000 NA | NA |
|||
| Plot | Lyso | Other | |||||||||||
| Expt C |
13 peptides |
41 spectra |
 |
0.657 0.000 | 1.000 |
0.343 0.000 | 1.000 |
||||||||
| Plot | Lyso | Other | |||||||||||
| Expt D |
1 peptide |
6 spectra |
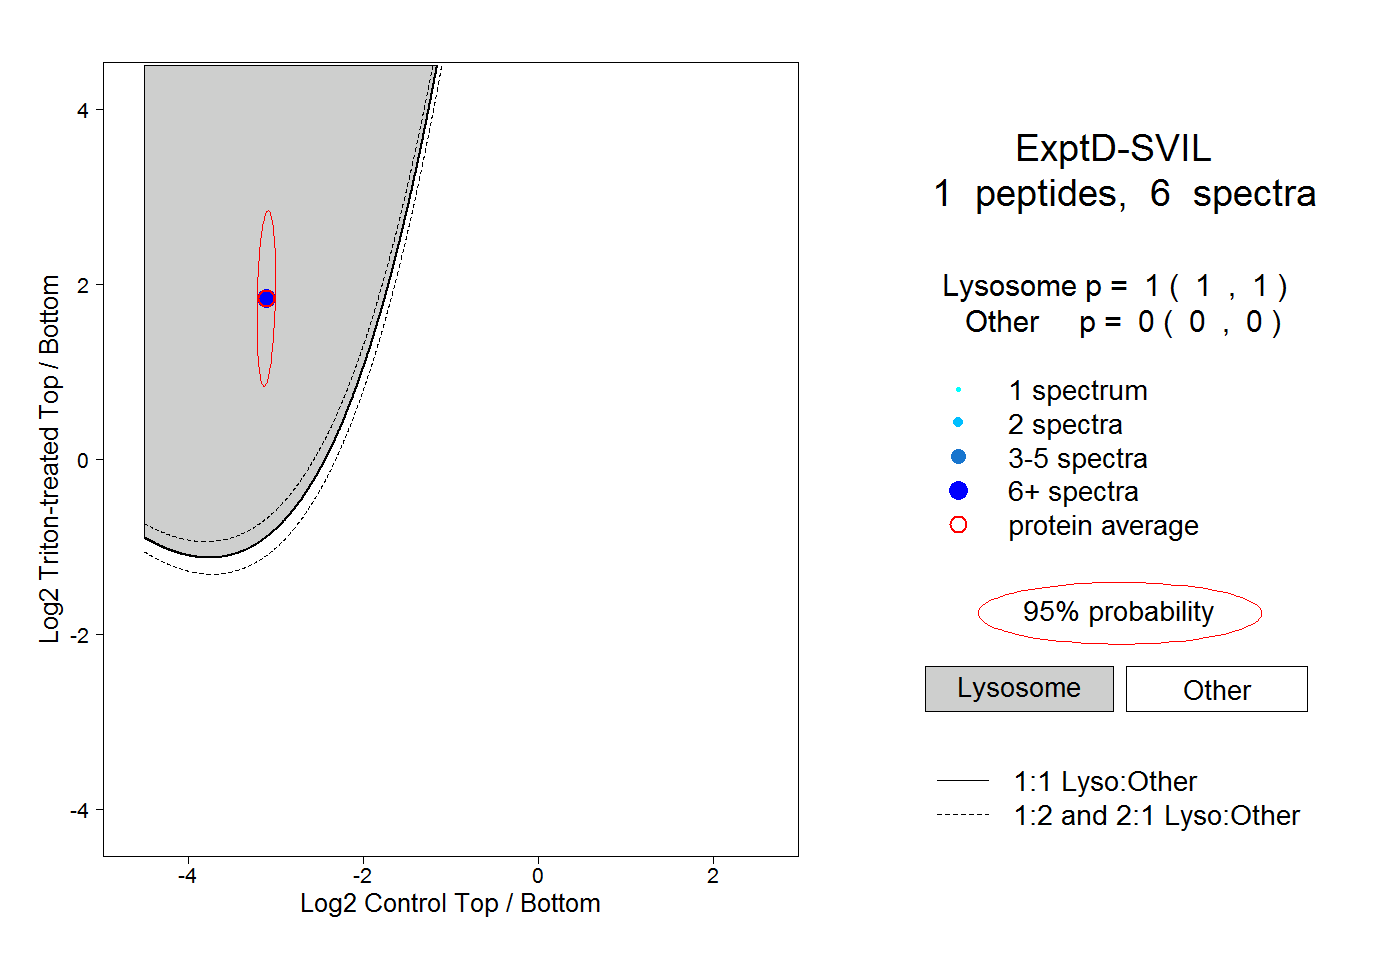 |
1.000 1.000 | 1.000 |
0.000 0.000 | 0.000 |