 5
5peptides
spectra
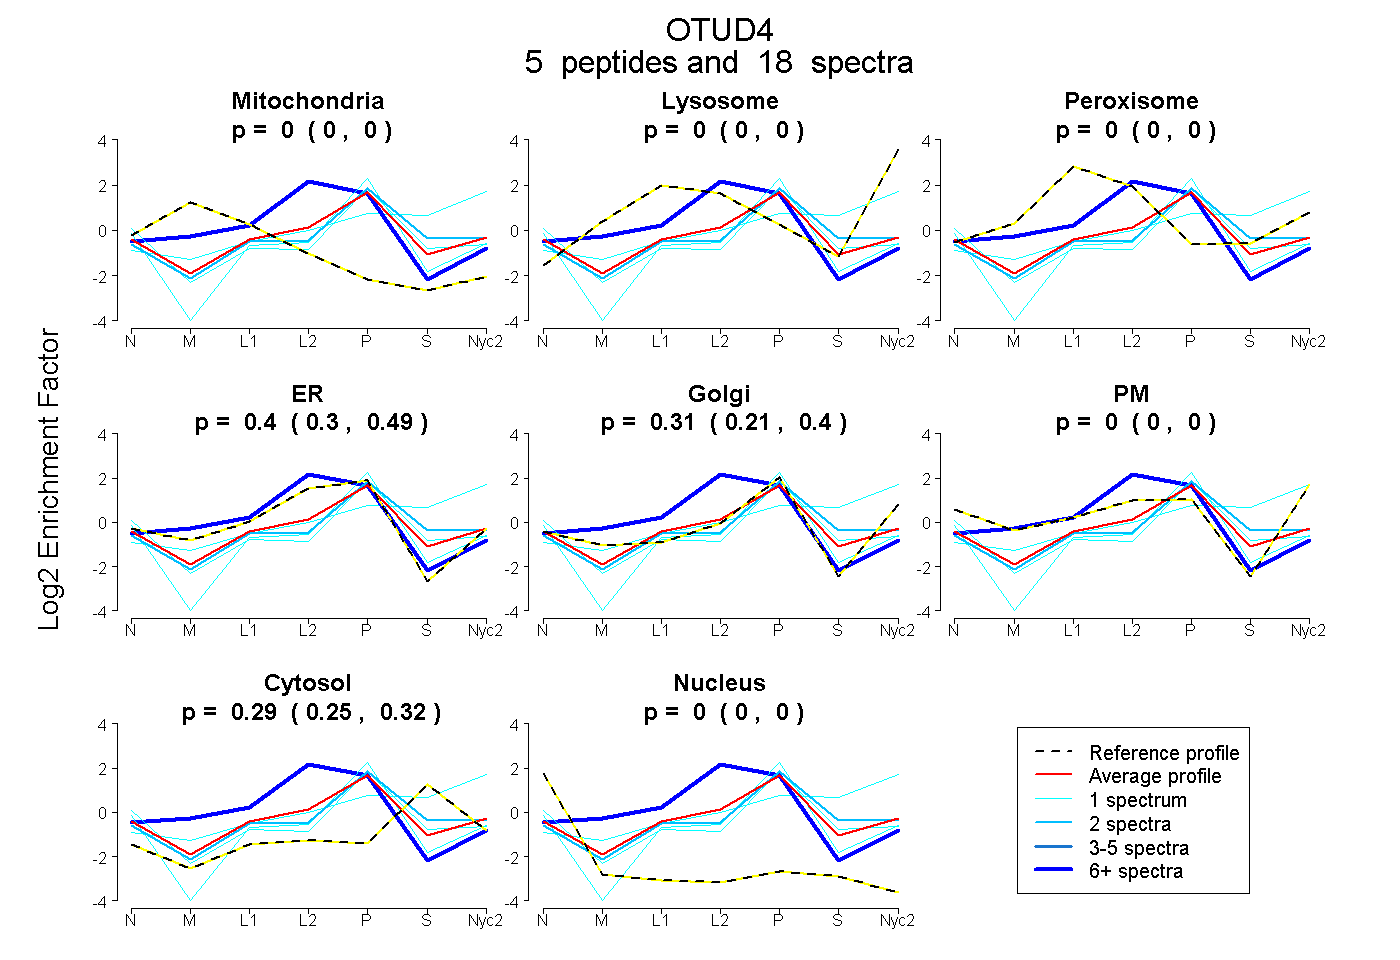
0.000 | 0.000
0.000 | 0.000
0.000 | 0.000
0.298 | 0.486
0.210 | 0.398
0.000 | 0.000
0.253 | 0.315
0.000 | 0.000
1peptide
spectra
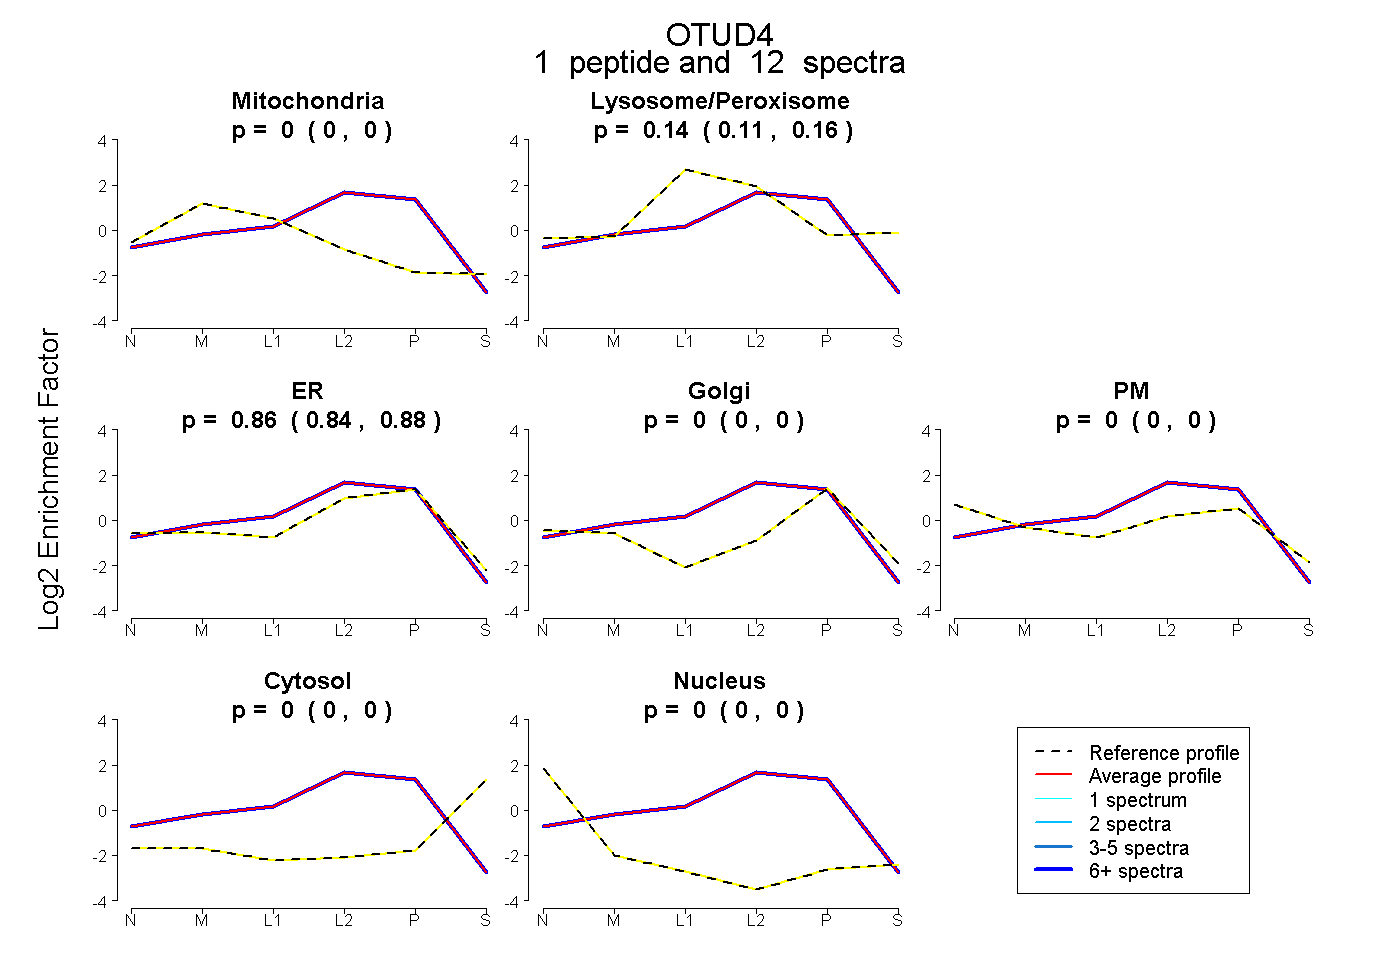
0.000 | 0.000
0.112 | 0.155
0.841 | 0.884
0.000 | 0.000
0.000 | 0.000
0.000 | 0.000
0.000 | 0.000
1peptide
spectra
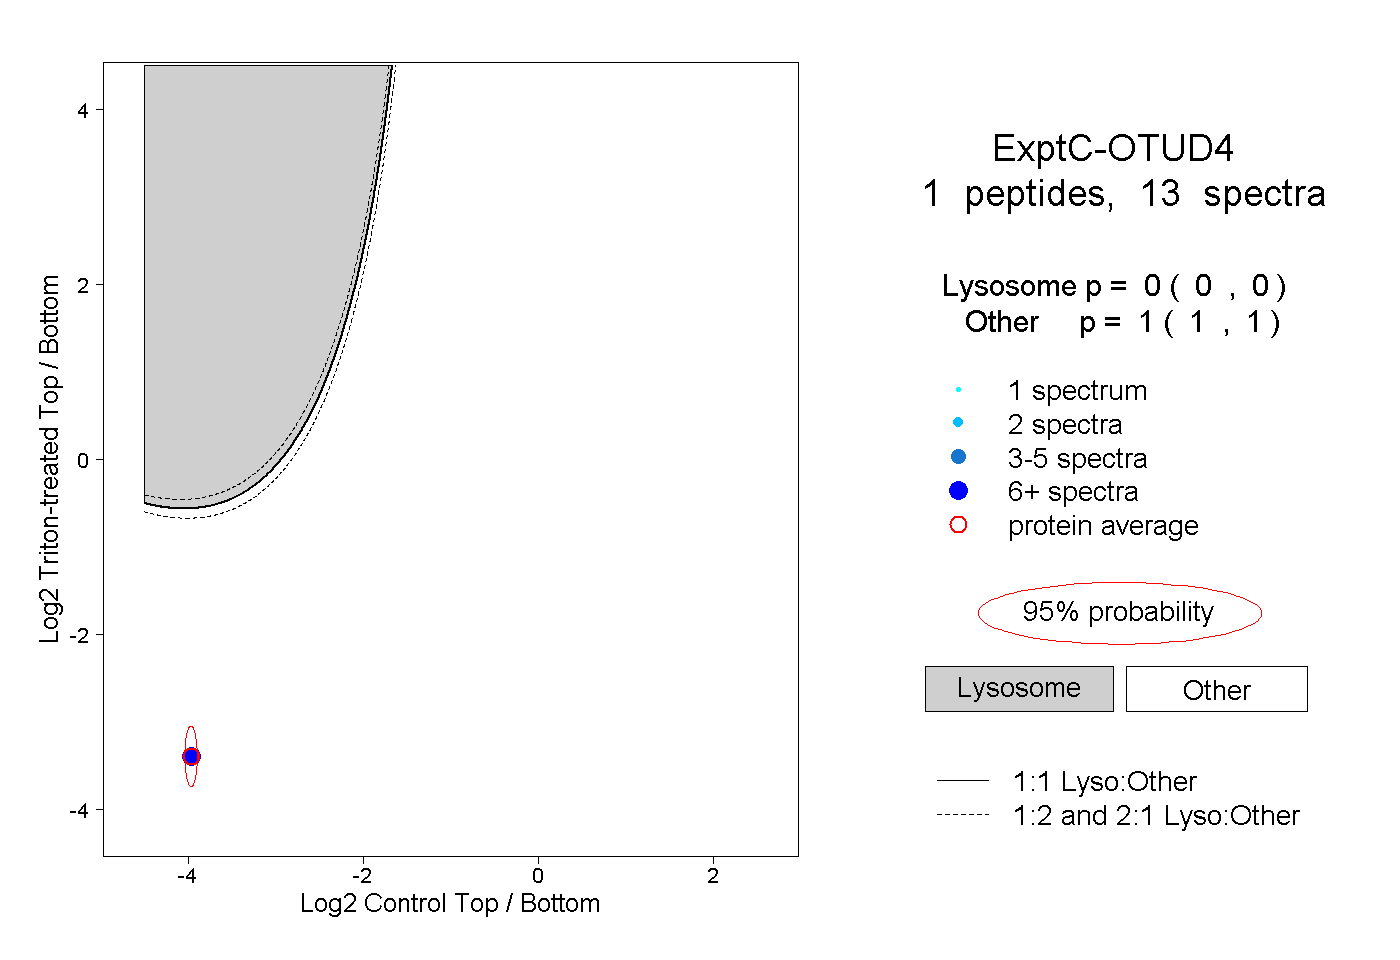
0.000 | 0.000
1.000 | 1.000
1peptide
spectrum
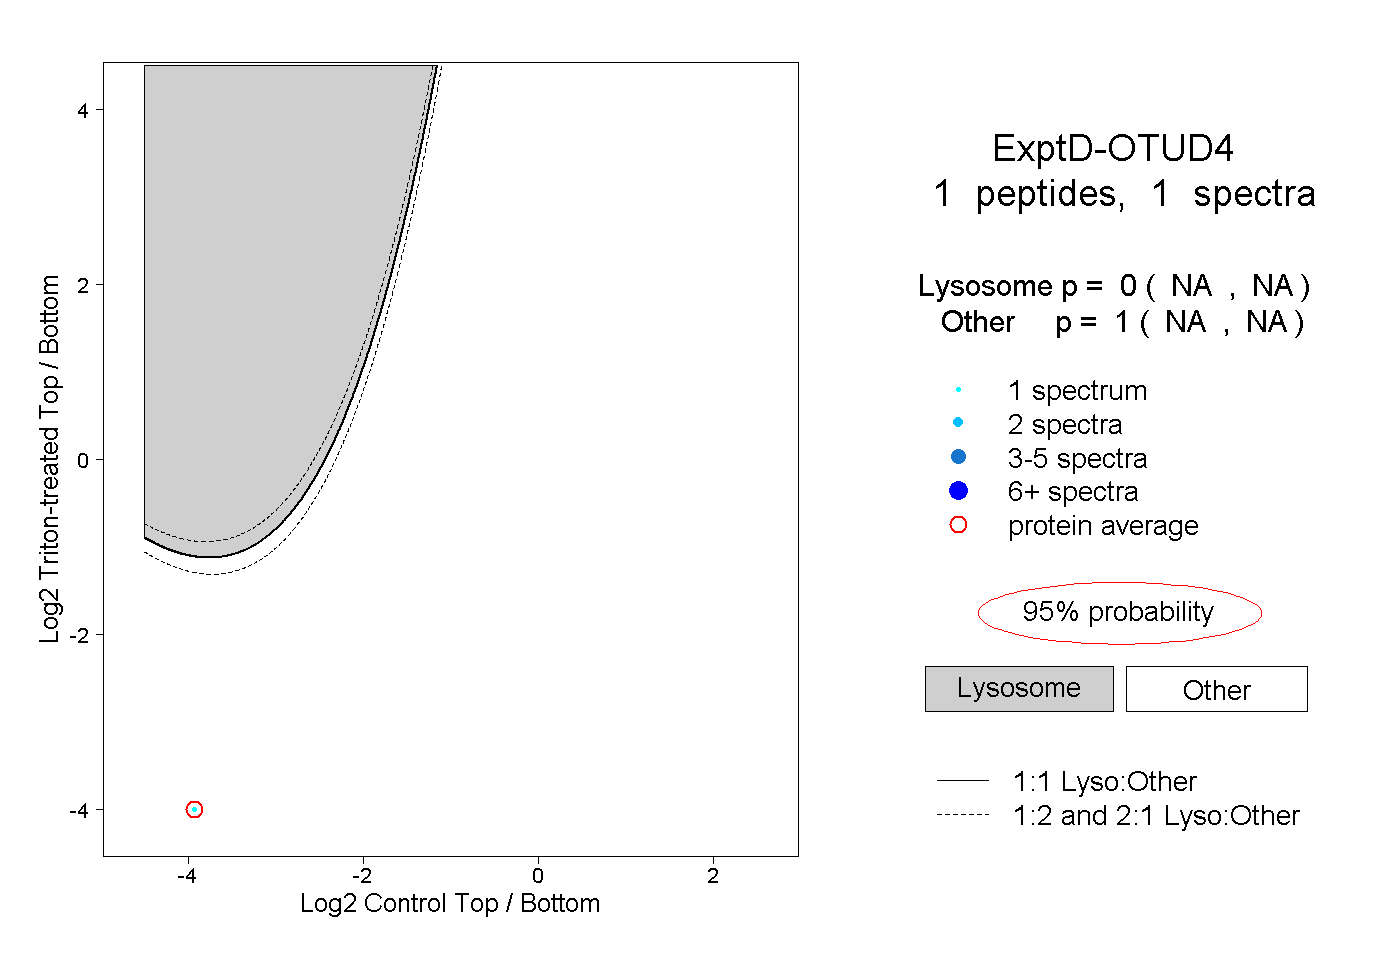
NA | NA
NA | NA