 5
5peptides
spectra
0.000 | 0.000
0.000 | 0.000
0.000 | 0.000
0.298 | 0.486
0.210 | 0.398
0.000 | 0.000
0.253 | 0.315
0.000 | 0.000
| Plot | Mito | Lyso | Perox | ER | Golgi | PM | Cytosol | Nucleus | |||||
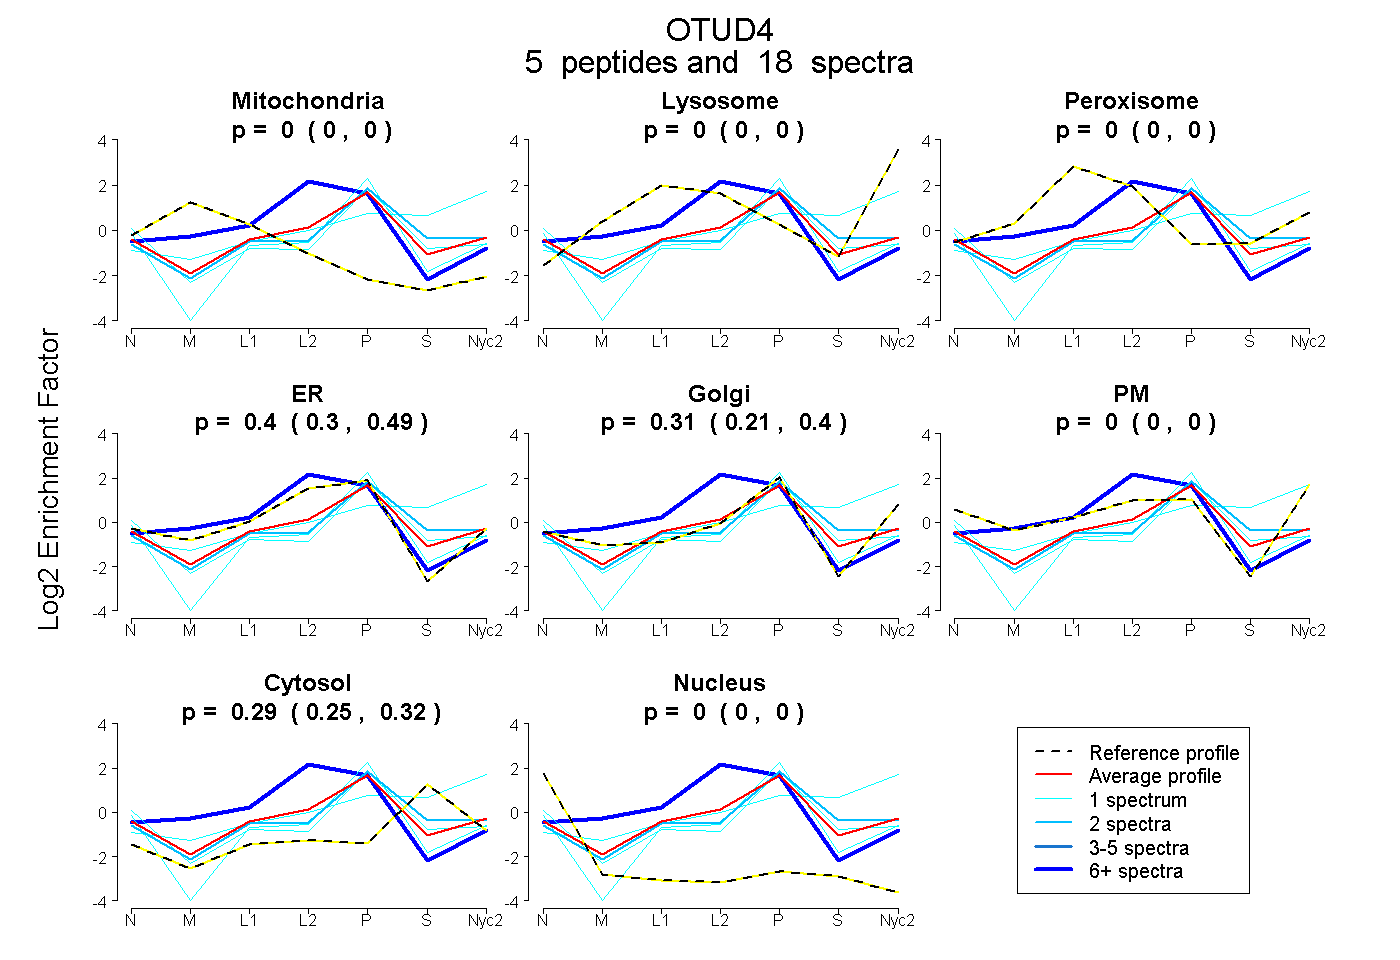
| Expt A |
5 peptides |
18 spectra |
|
0.000 0.000 | 0.000 |
0.000 0.000 | 0.000 |
0.000 0.000 | 0.000 |
0.404 0.298 | 0.486 |
0.309 0.210 | 0.398 |
0.000 0.000 | 0.000 |
0.287 0.253 | 0.315 |
0.000 0.000 | 0.000 |
| 1 spectrum, QFYNQTYGSR | 0.000 | 0.000 | 0.000 | 0.114 | 0.609 | 0.000 | 0.160 | 0.117 | ||
| 1 spectrum, EAVSAEPEPK | 0.000 | 0.358 | 0.000 | 0.000 | 0.210 | 0.000 | 0.432 | 0.000 | ||
| 13 spectra, LGLYR | 0.014 | 0.000 | 0.108 | 0.878 | 0.000 | 0.000 | 0.000 | 0.000 | ||
| 1 spectrum, VEQSSQTR | 0.000 | 0.000 | 0.000 | 0.073 | 0.568 | 0.000 | 0.290 | 0.069 | ||
| 2 spectra, VPSQITR | 0.000 | 0.000 | 0.000 | 0.174 | 0.451 | 0.000 | 0.376 | 0.000 |
| Plot | Mito | Lyso or Perox | ER | Golgi | PM | Cytosol | Nucleus | ||||||
| Expt B |
1 peptide |
12 spectra |
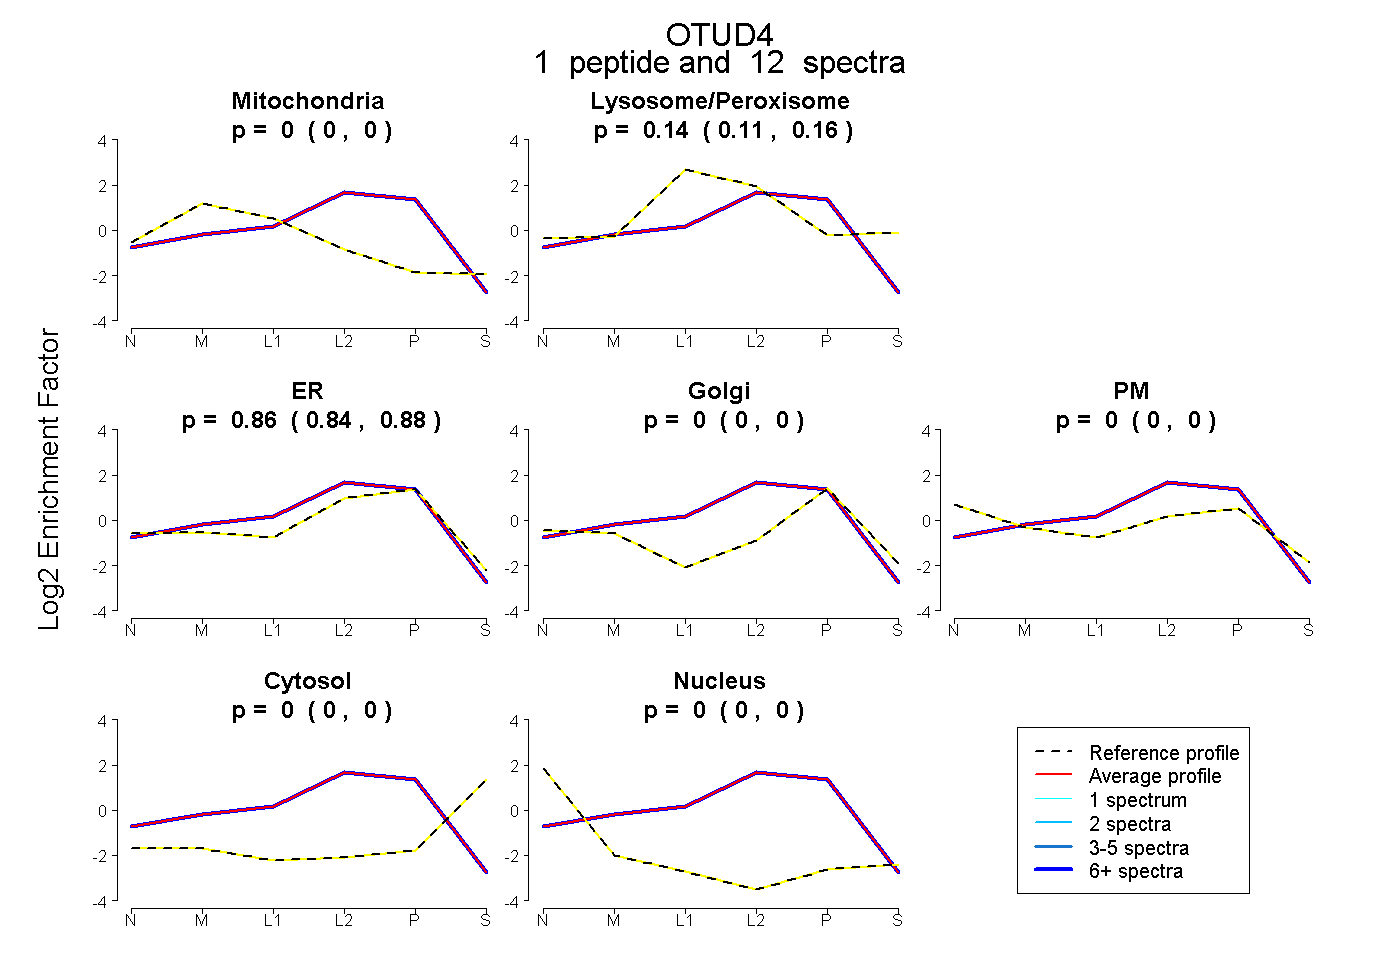 |
0.000 0.000 | 0.000 |
0.135 0.112 | 0.155 |
0.865 0.841 | 0.884 |
0.000 0.000 | 0.000 |
0.000 0.000 | 0.000 |
0.000 0.000 | 0.000 |
0.000 0.000 | 0.000 |
|||
| Plot | Lyso | Other | |||||||||||
| Expt C |
1 peptide |
13 spectra |
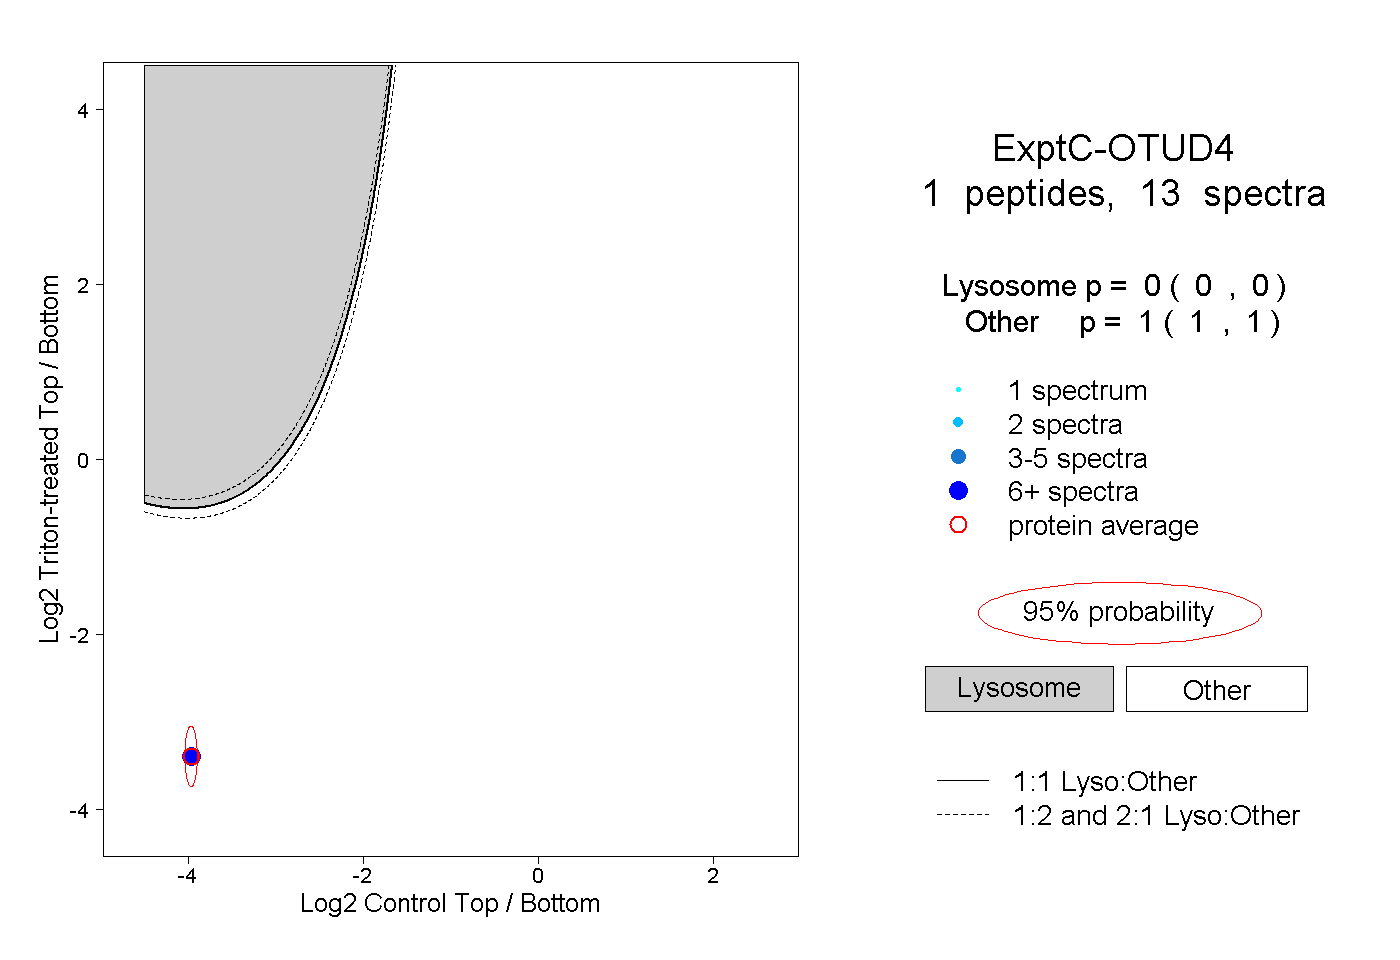 |
0.000 0.000 | 0.000 |
1.000 1.000 | 1.000 |
||||||||
| Plot | Lyso | Other | |||||||||||
| Expt D |
1 peptide |
1 spectrum |
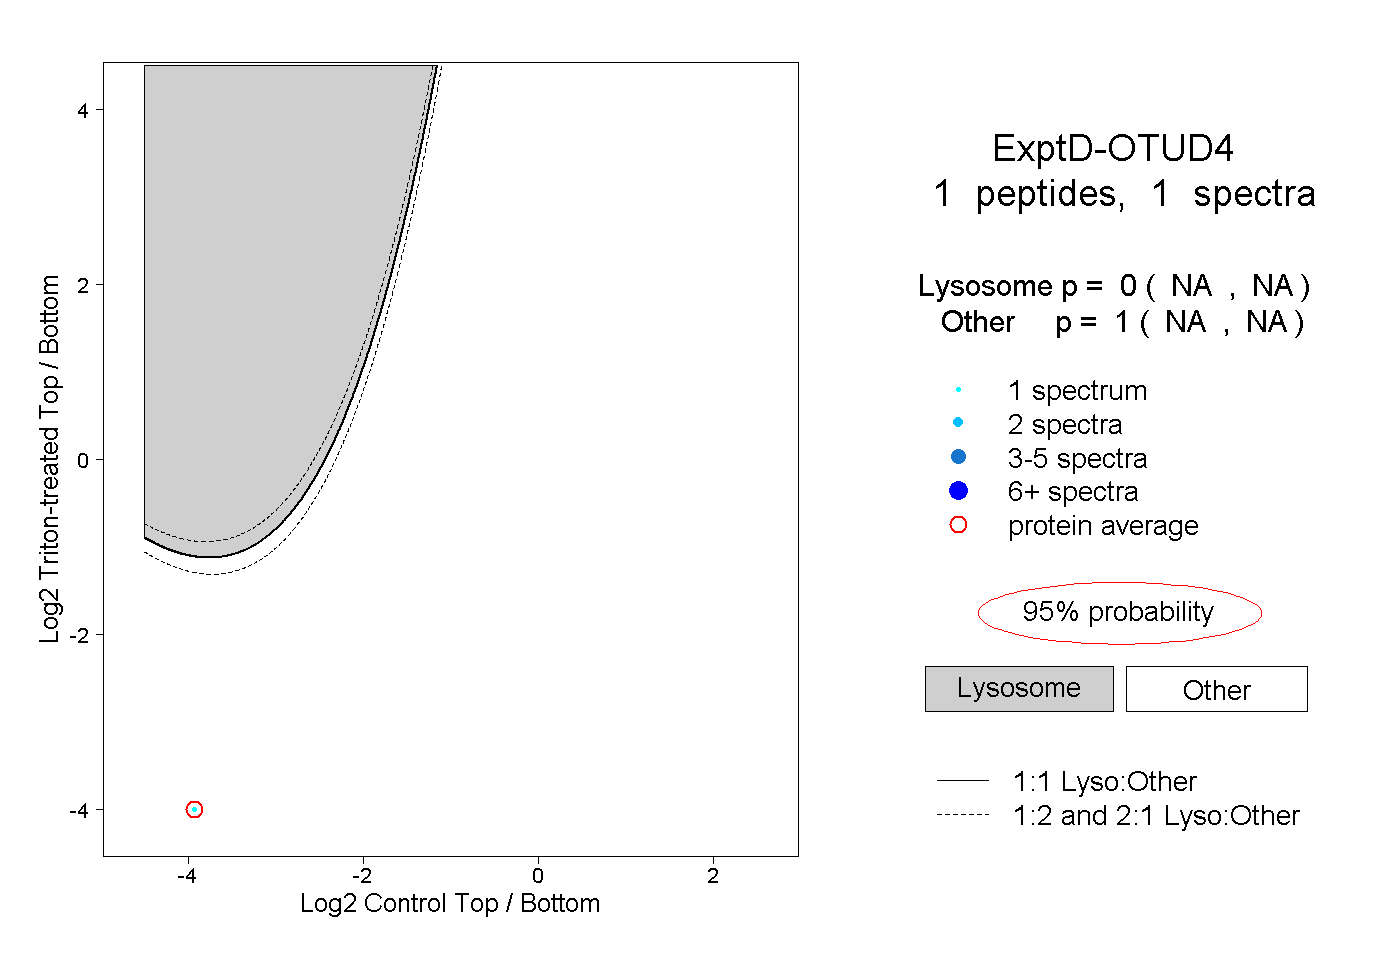 |
0.000 NA | NA |
1.000 NA | NA |