 13
13peptides
spectra
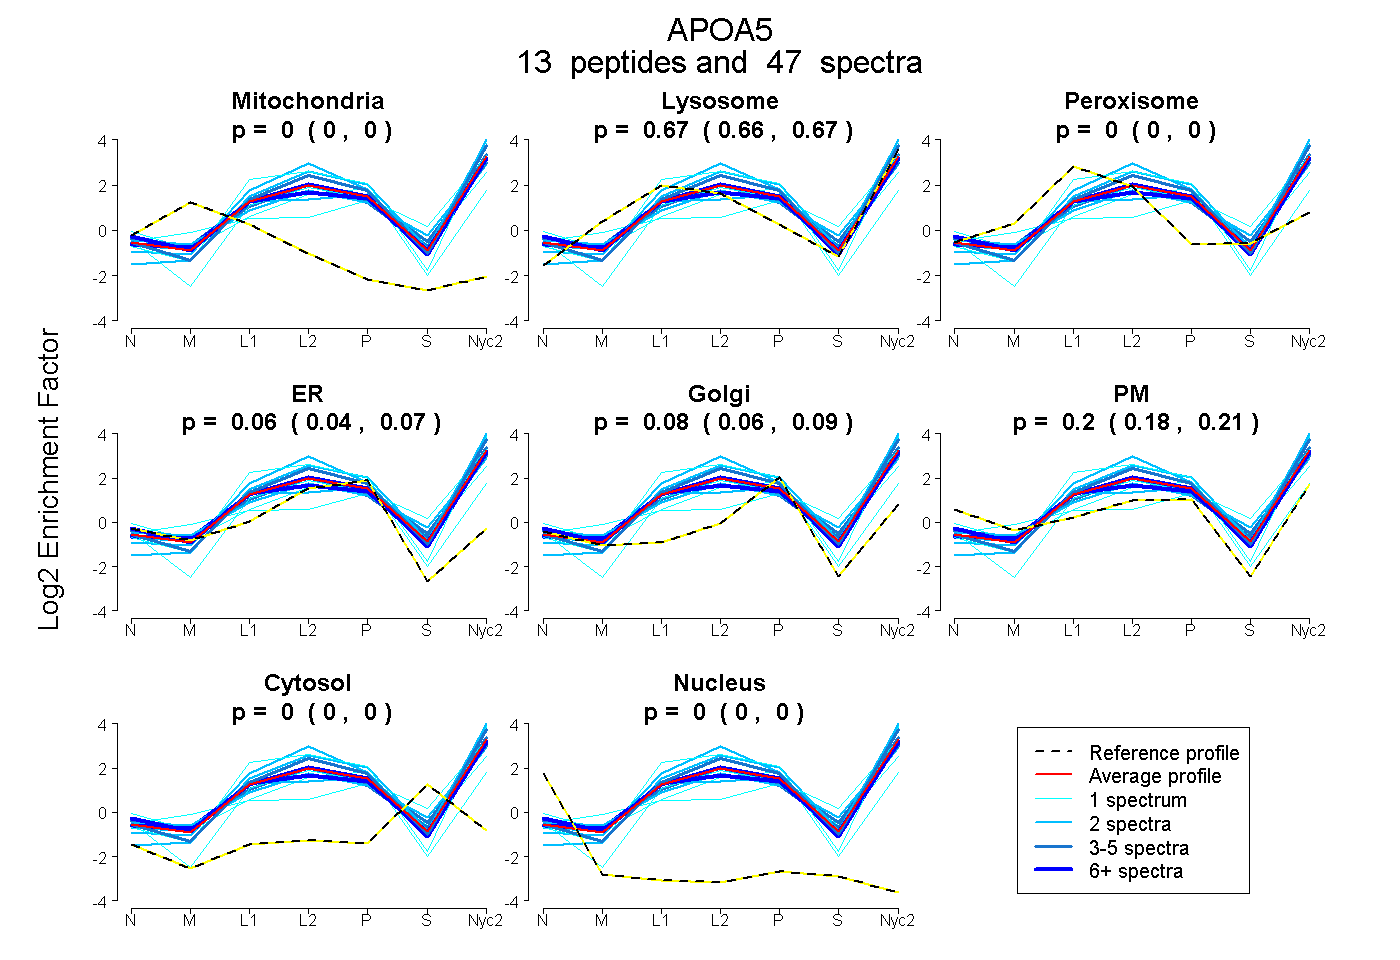
0.000 | 0.000
0.659 | 0.671
0.000 | 0.000
0.039 | 0.069
0.062 | 0.093
0.185 | 0.213
0.000 | 0.000
0.000 | 0.000
2peptides
spectra
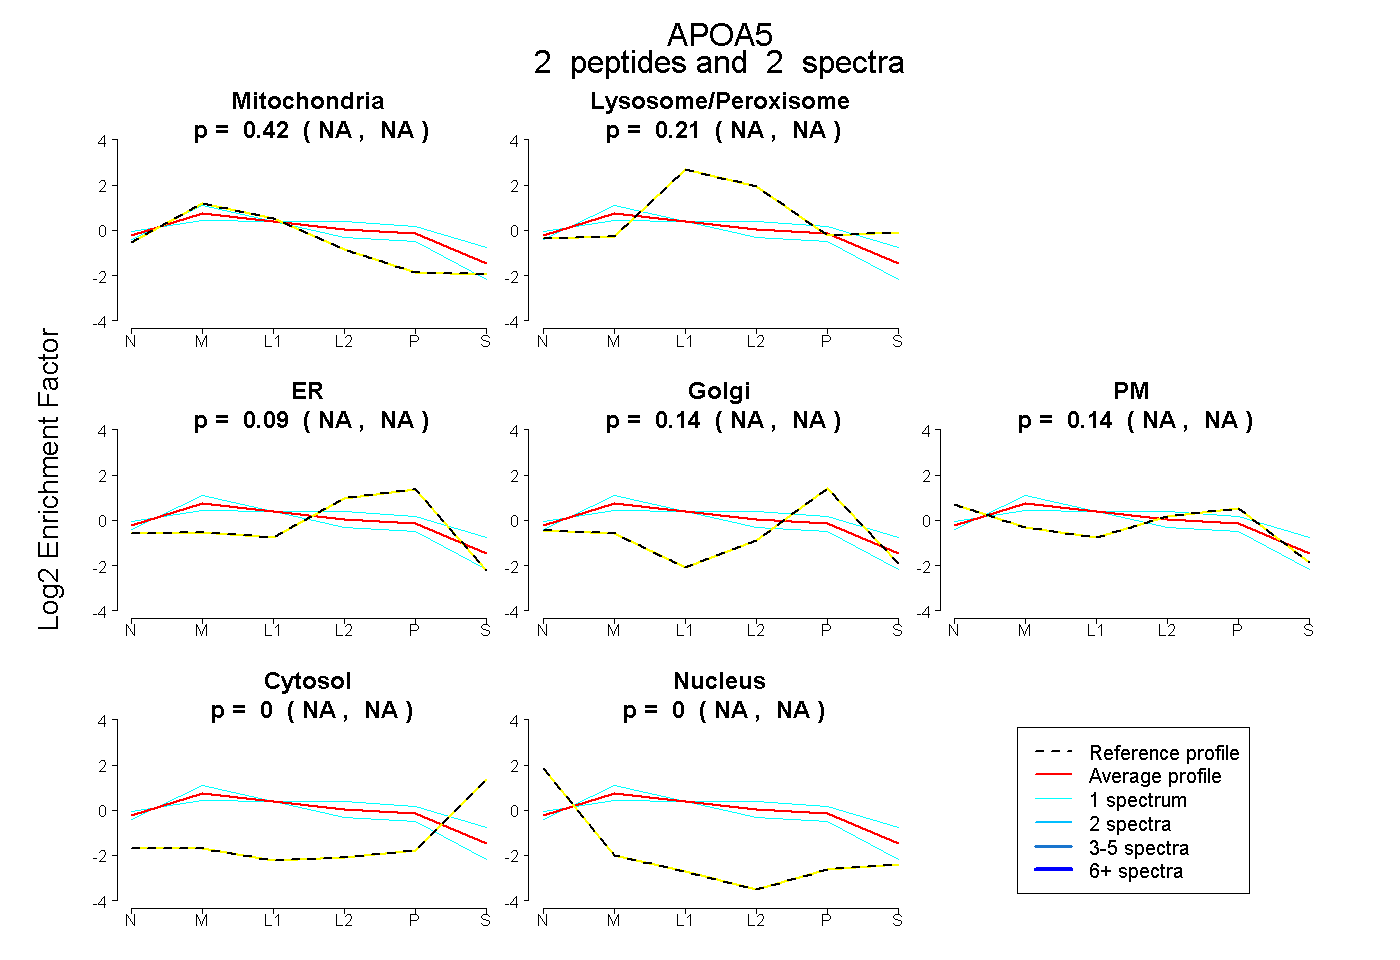
NA | NA
NA | NA
NA | NA
NA | NA
NA | NA
NA | NA
NA | NA
15peptides
spectra
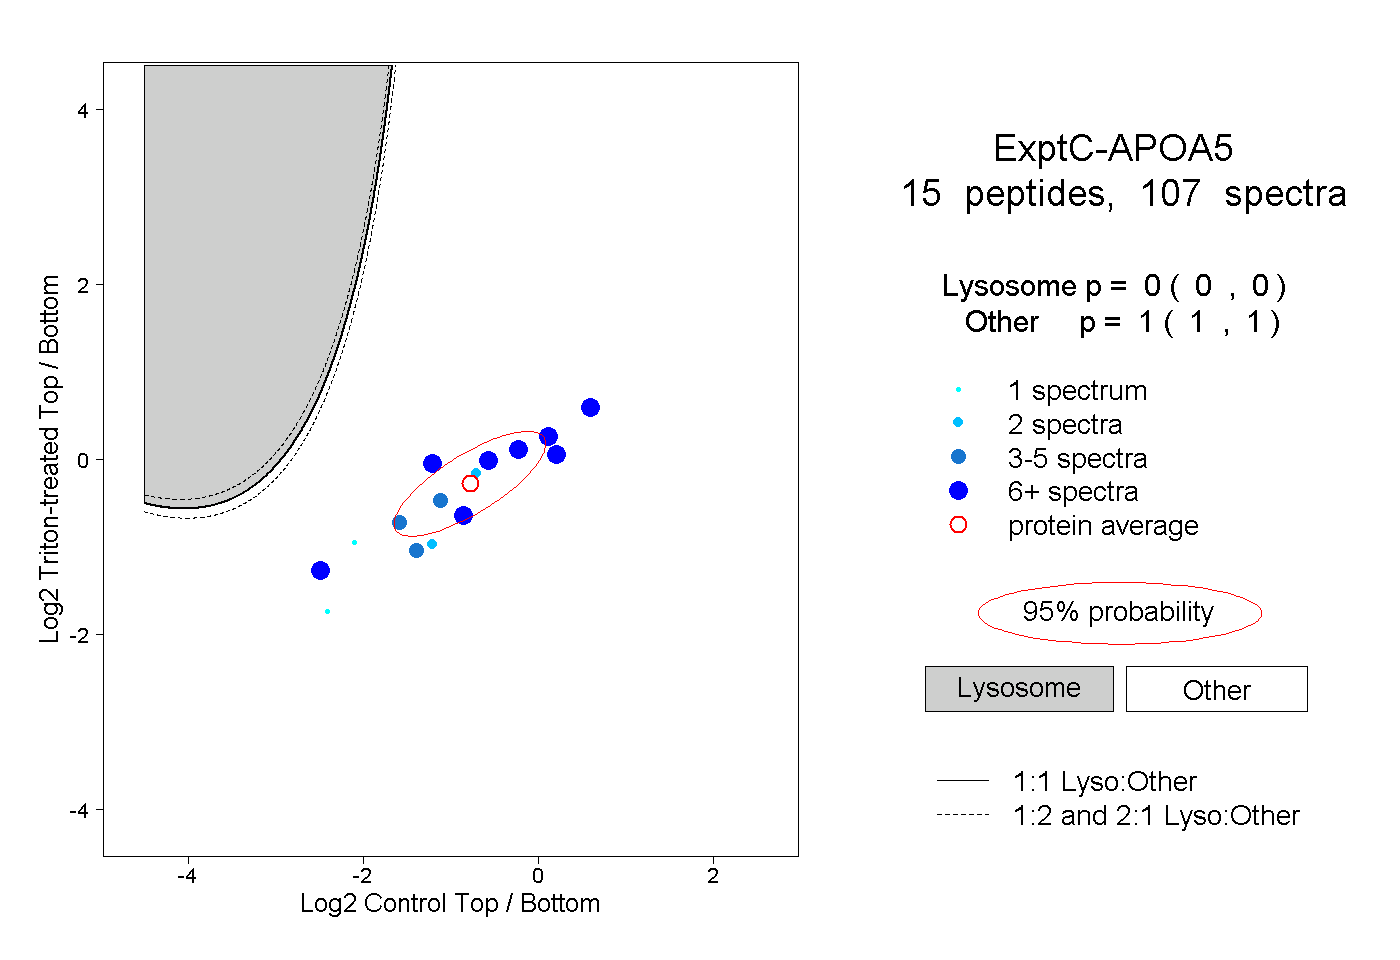
0.000 | 0.000
1.000 | 1.000
2peptides
spectra
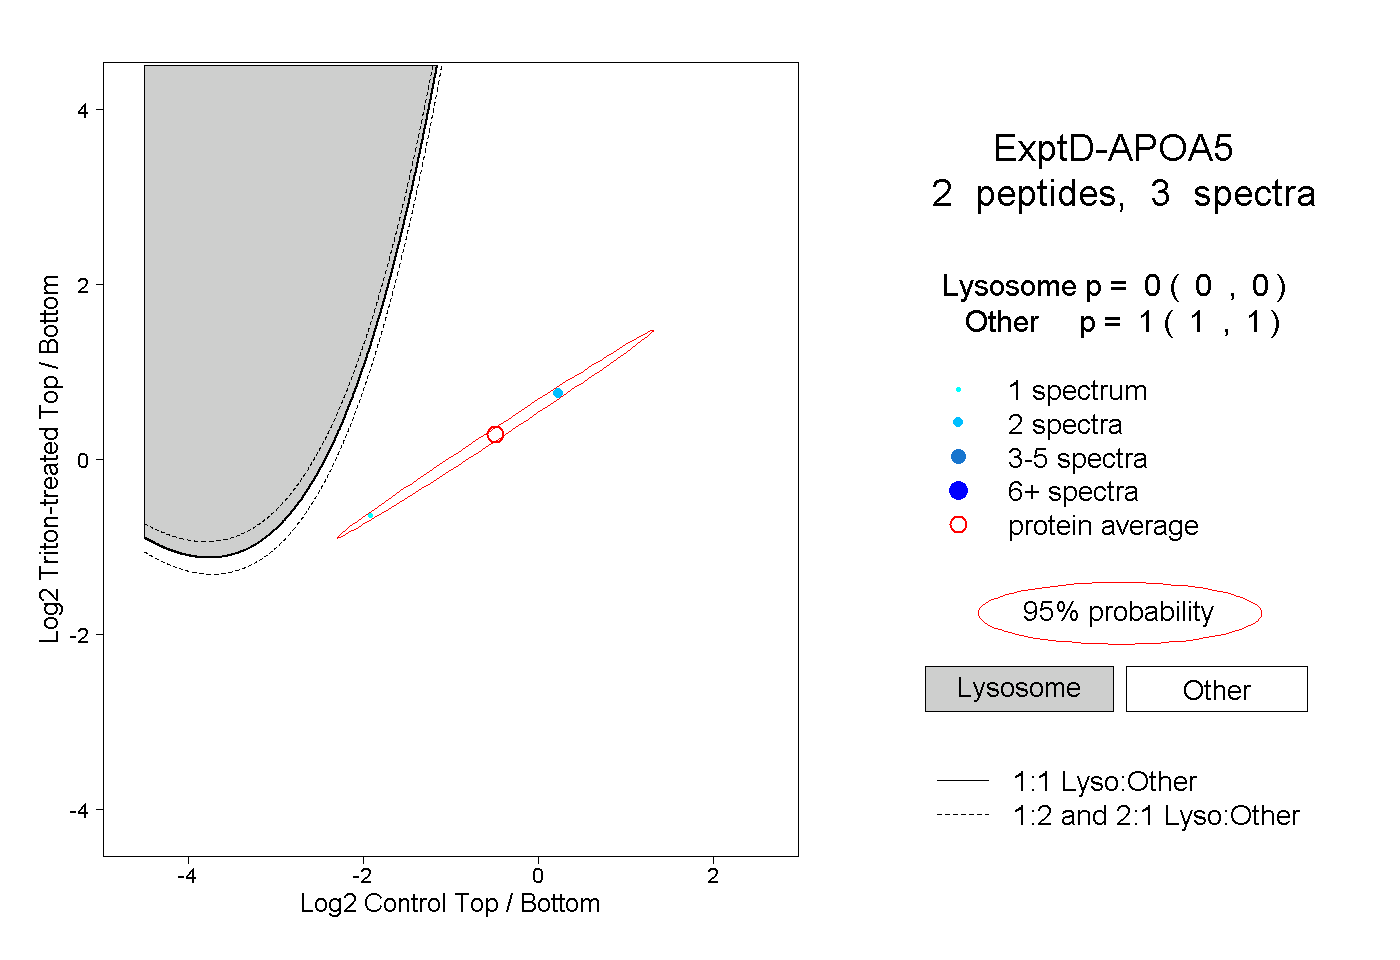
0.000 | 0.000
1.000 | 1.000