 13
13peptides
spectra
0.000 | 0.000
0.659 | 0.671
0.000 | 0.000
0.039 | 0.069
0.062 | 0.093
0.185 | 0.213
0.000 | 0.000
0.000 | 0.000
| Plot | Mito | Lyso | Perox | ER | Golgi | PM | Cytosol | Nucleus | |||||
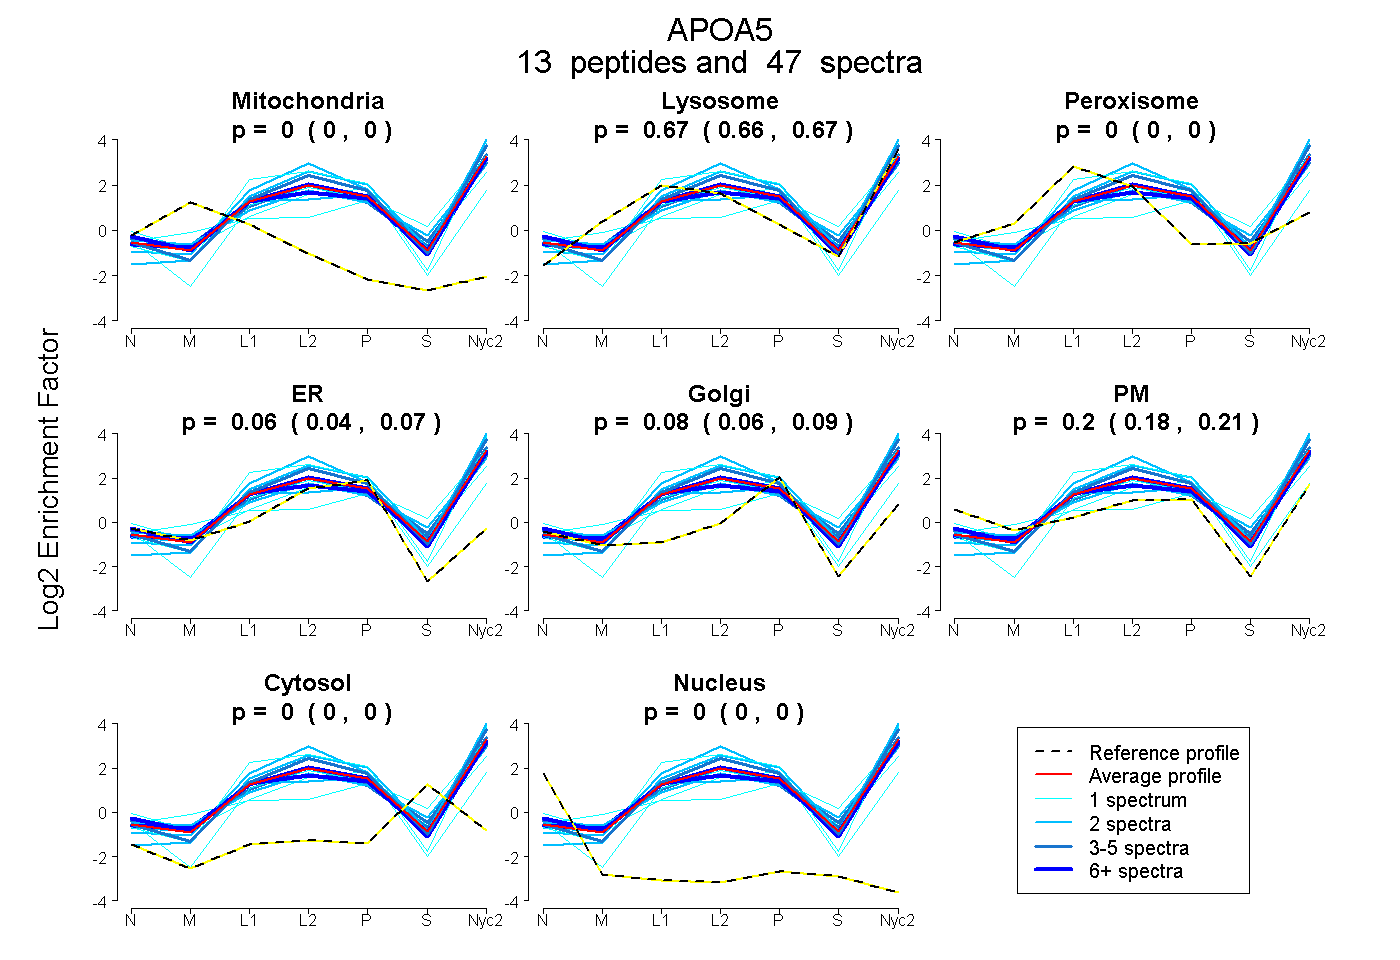
| Expt A |
13 peptides |
47 spectra |
|
0.000 0.000 | 0.000 |
0.666 0.659 | 0.671 |
0.000 0.000 | 0.000 |
0.055 0.039 | 0.069 |
0.079 0.062 | 0.093 |
0.201 0.185 | 0.213 |
0.000 0.000 | 0.000 |
0.000 0.000 | 0.000 |
| 5 spectra, VSTDGADNR | 0.000 | 0.691 | 0.000 | 0.060 | 0.006 | 0.243 | 0.000 | 0.000 | ||
| 5 spectra, DSLDPQALSDEVR | 0.000 | 0.672 | 0.000 | 0.000 | 0.000 | 0.320 | 0.007 | 0.000 | ||
| 1 spectrum, CVQTLSHK | 0.000 | 0.231 | 0.000 | 0.327 | 0.060 | 0.382 | 0.000 | 0.000 | ||
| 2 spectra, QLQQELEEVSTR | 0.000 | 0.871 | 0.000 | 0.129 | 0.000 | 0.000 | 0.000 | 0.000 | ||
| 15 spectra, GMMGQQQK | 0.000 | 0.658 | 0.000 | 0.106 | 0.044 | 0.192 | 0.000 | 0.000 | ||
| 6 spectra, SVAPHAVASPAR | 0.000 | 0.592 | 0.000 | 0.000 | 0.068 | 0.338 | 0.002 | 0.000 | ||
| 1 spectrum, SFWEYFGQNSQGK | 0.000 | 0.774 | 0.000 | 0.154 | 0.000 | 0.072 | 0.000 | 0.000 | ||
| 1 spectrum, LEPYMAAK | 0.000 | 0.624 | 0.000 | 0.000 | 0.060 | 0.143 | 0.173 | 0.000 | ||
| 1 spectrum, DLHTSIQR | 0.000 | 0.527 | 0.000 | 0.000 | 0.303 | 0.085 | 0.085 | 0.000 | ||
| 4 spectra, ELFHPYAER | 0.000 | 0.617 | 0.000 | 0.064 | 0.000 | 0.277 | 0.042 | 0.000 | ||
| 2 spectra, DELSTFIR | 0.000 | 0.682 | 0.000 | 0.001 | 0.281 | 0.001 | 0.034 | 0.000 | ||
| 2 spectra, LAQDPEGIR | 0.000 | 0.854 | 0.000 | 0.060 | 0.086 | 0.000 | 0.000 | 0.000 | ||
| 2 spectra, LVTGIGHHVQELHR | 0.000 | 0.627 | 0.000 | 0.000 | 0.022 | 0.261 | 0.089 | 0.000 |
| Plot | Mito | Lyso or Perox | ER | Golgi | PM | Cytosol | Nucleus | ||||||
| Expt B |
2 peptides |
2 spectra |
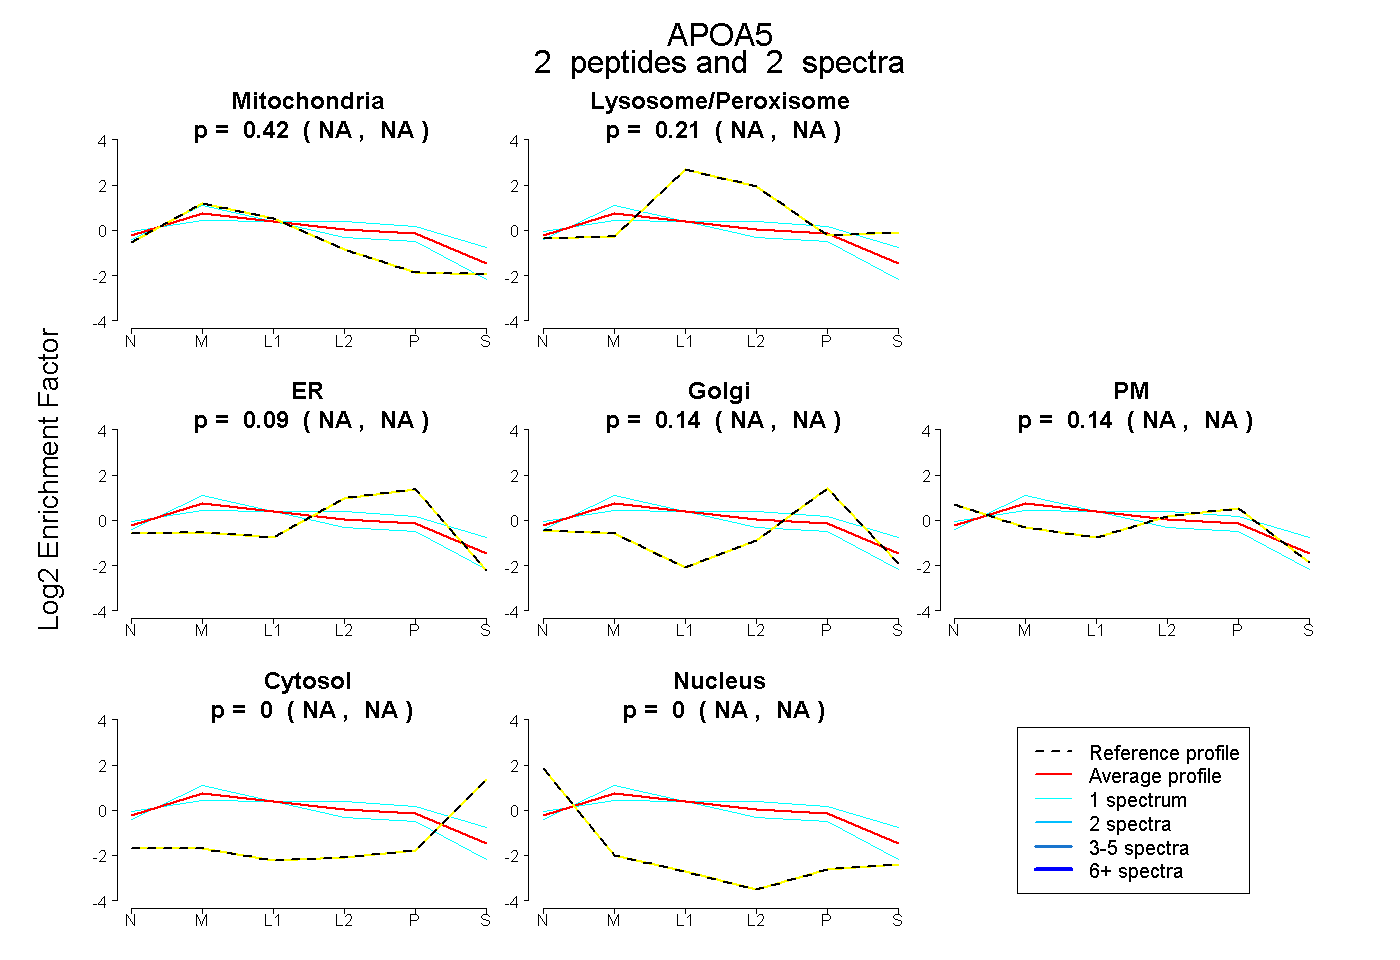 |
0.424 NA | NA |
0.214 NA | NA |
0.087 NA | NA |
0.138 NA | NA |
0.137 NA | NA |
0.000 NA | NA |
0.000 NA | NA |
|||
| Plot | Lyso | Other | |||||||||||
| Expt C |
15 peptides |
107 spectra |
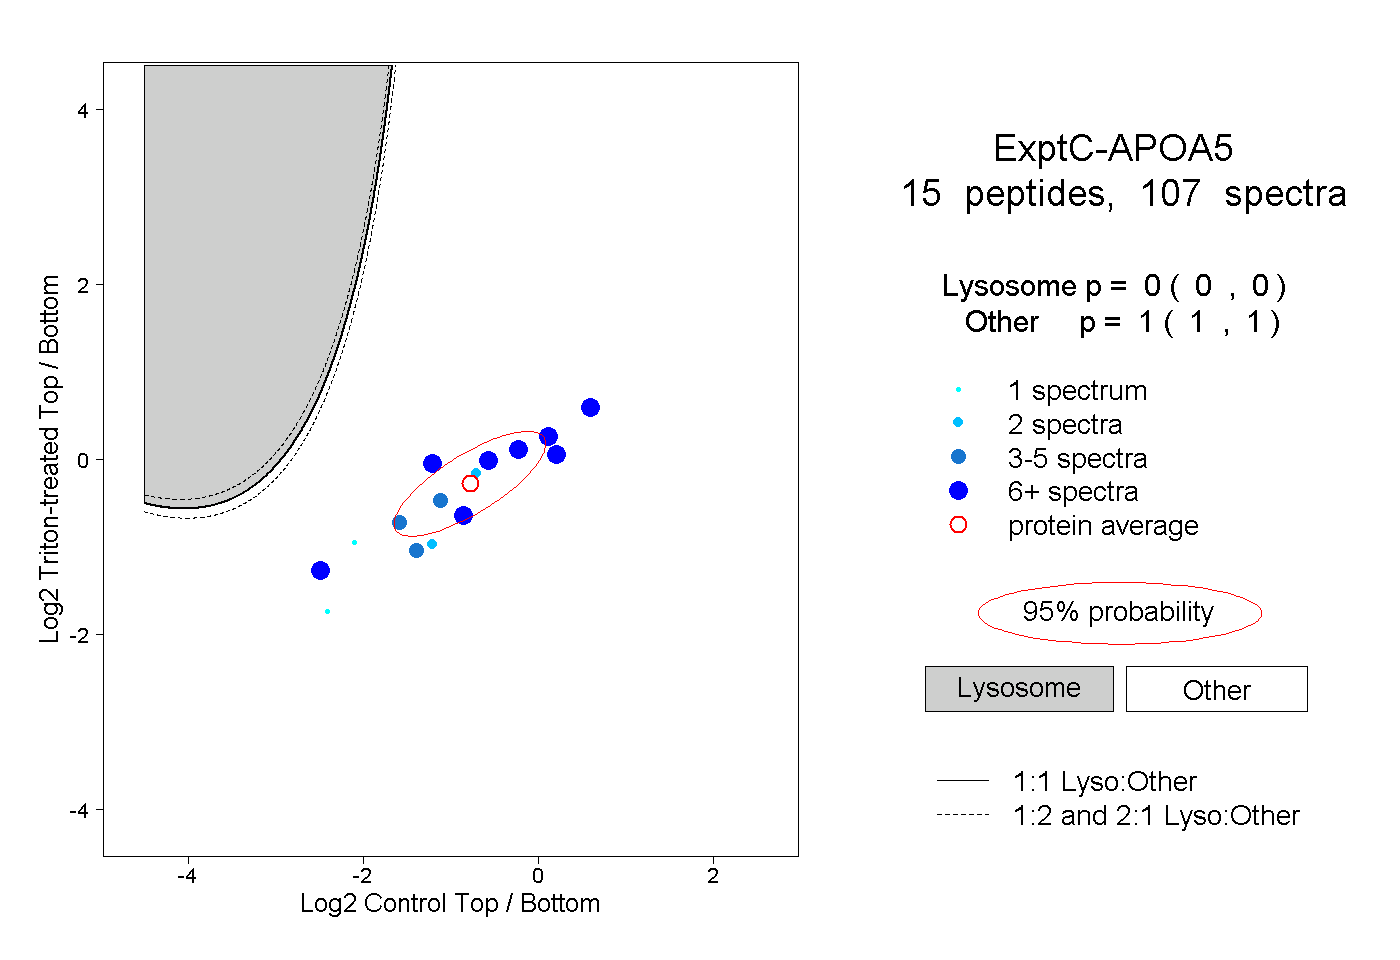 |
0.000 0.000 | 0.000 |
1.000 1.000 | 1.000 |
||||||||
| Plot | Lyso | Other | |||||||||||
| Expt D |
2 peptides |
3 spectra |
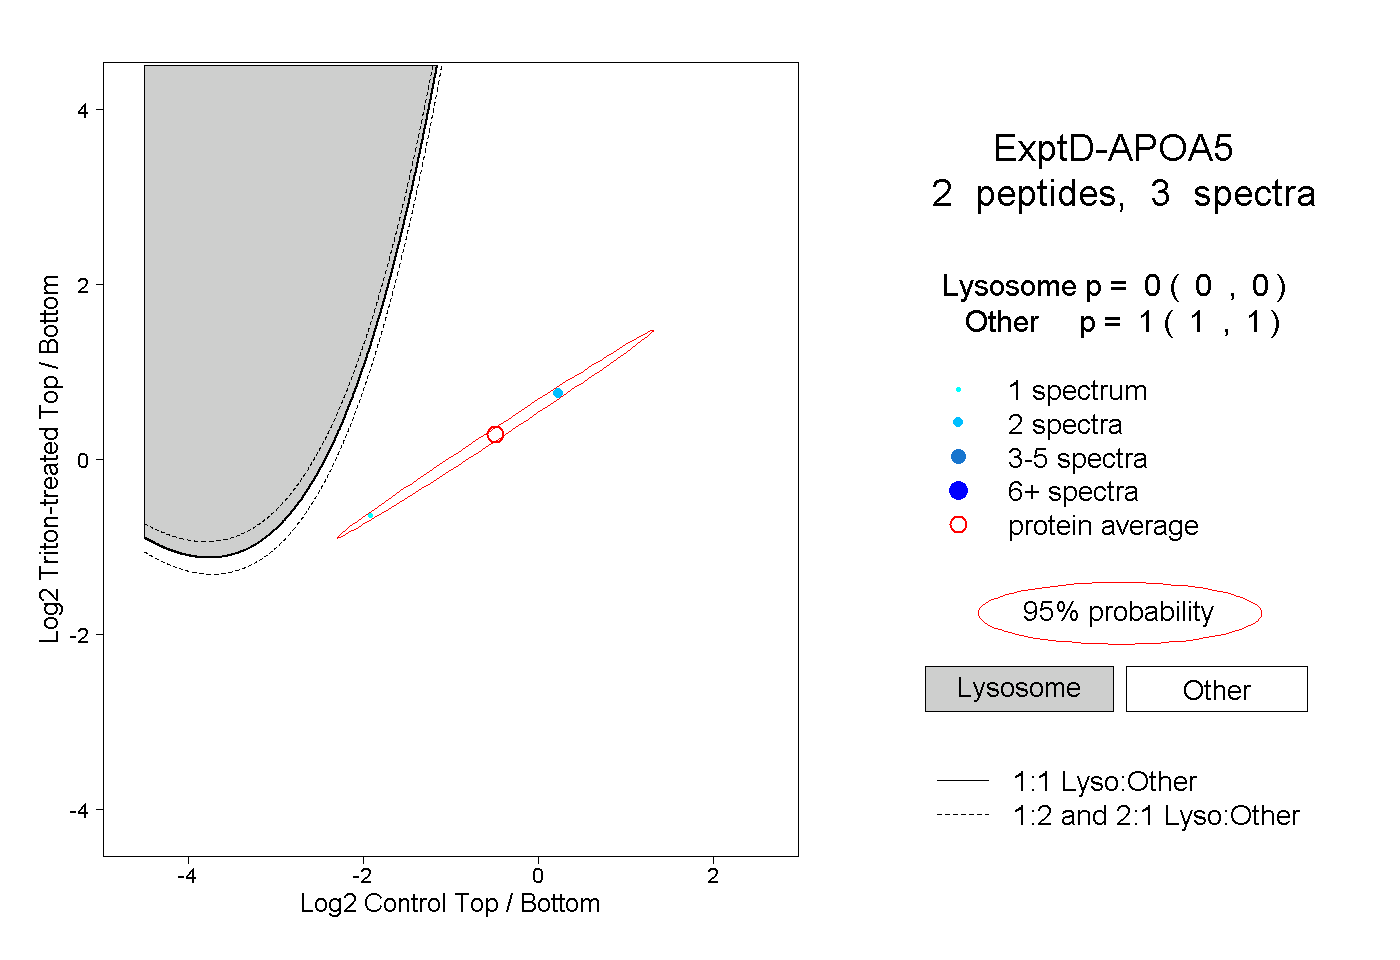 |
0.000 0.000 | 0.000 |
1.000 1.000 | 1.000 |