 12
12peptides
spectra
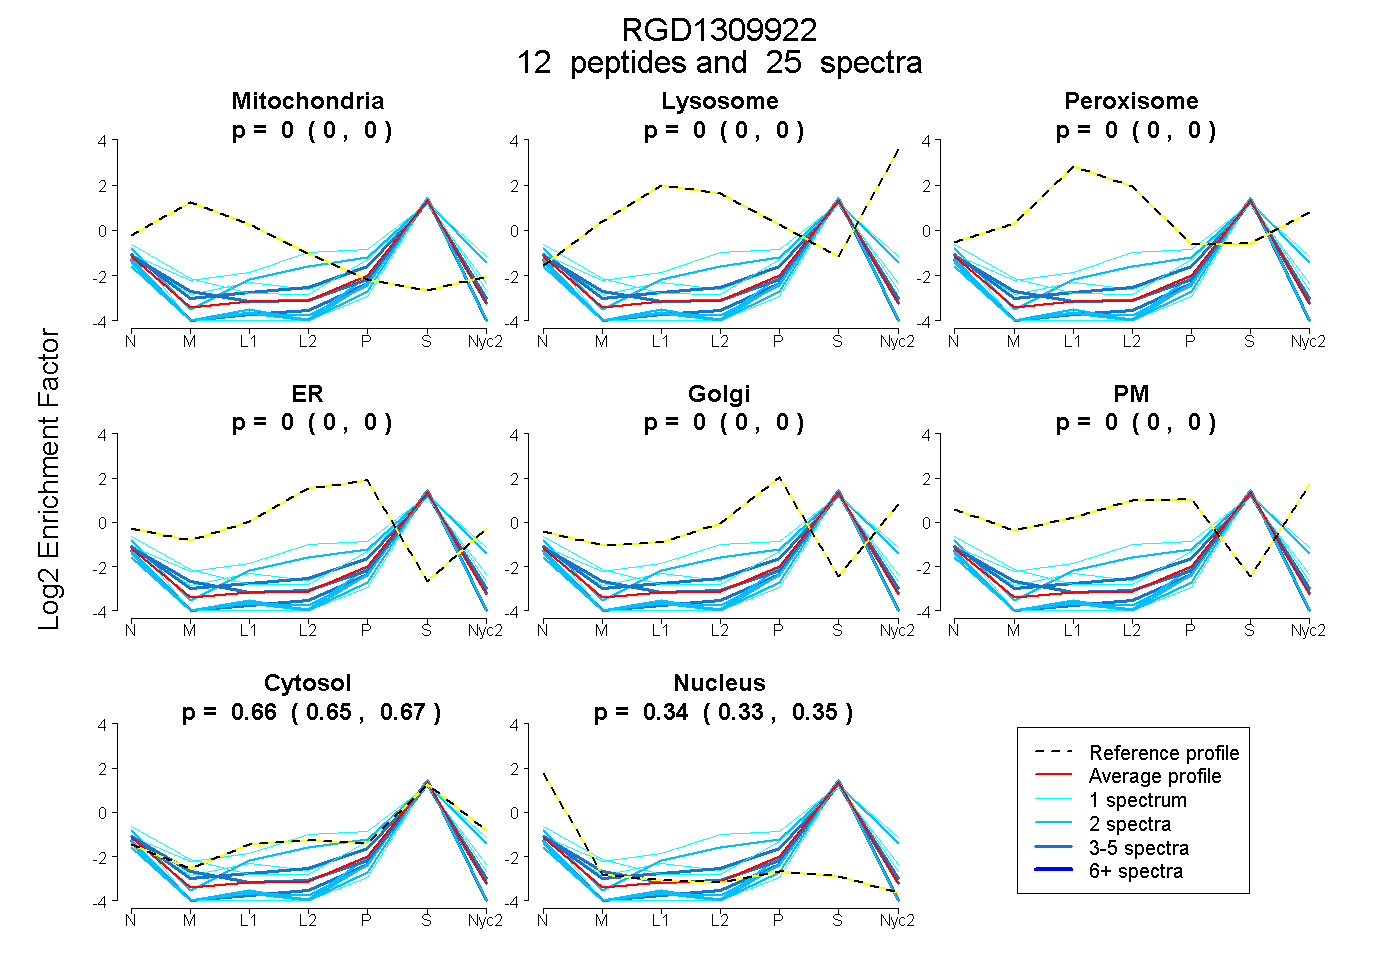
0.000 | 0.000
0.000 | 0.000
0.000 | 0.000
0.000 | 0.000
0.000 | 0.000
0.000 | 0.000
0.653 | 0.670
0.328 | 0.345
6peptides
spectra
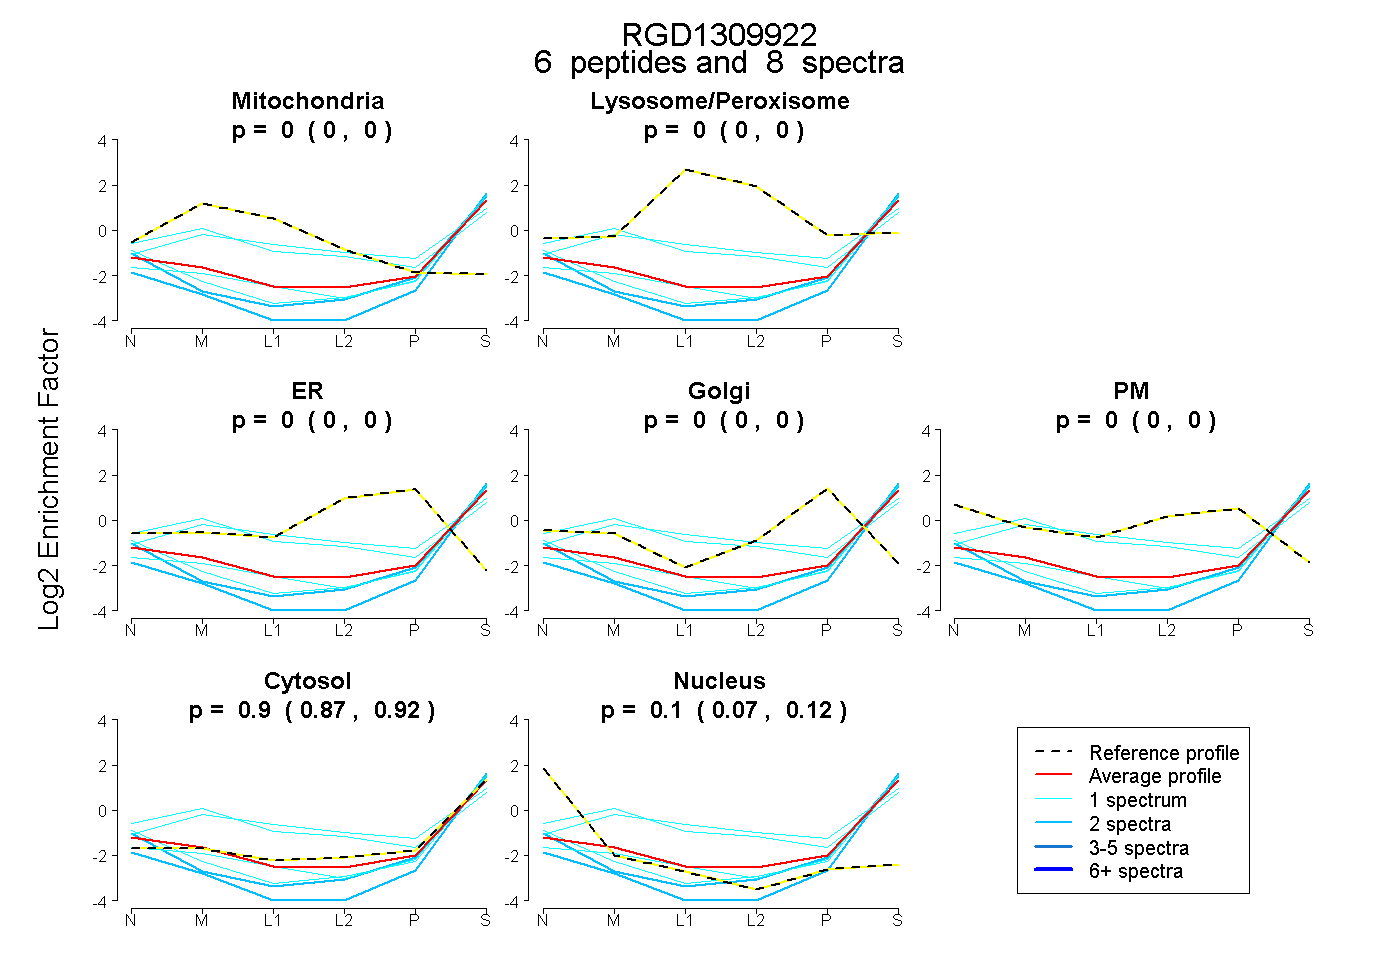
0.000 | 0.000
0.000 | 0.000
0.000 | 0.000
0.000 | 0.000
0.000 | 0.000
0.870 | 0.919
0.074 | 0.124
2peptides
spectra
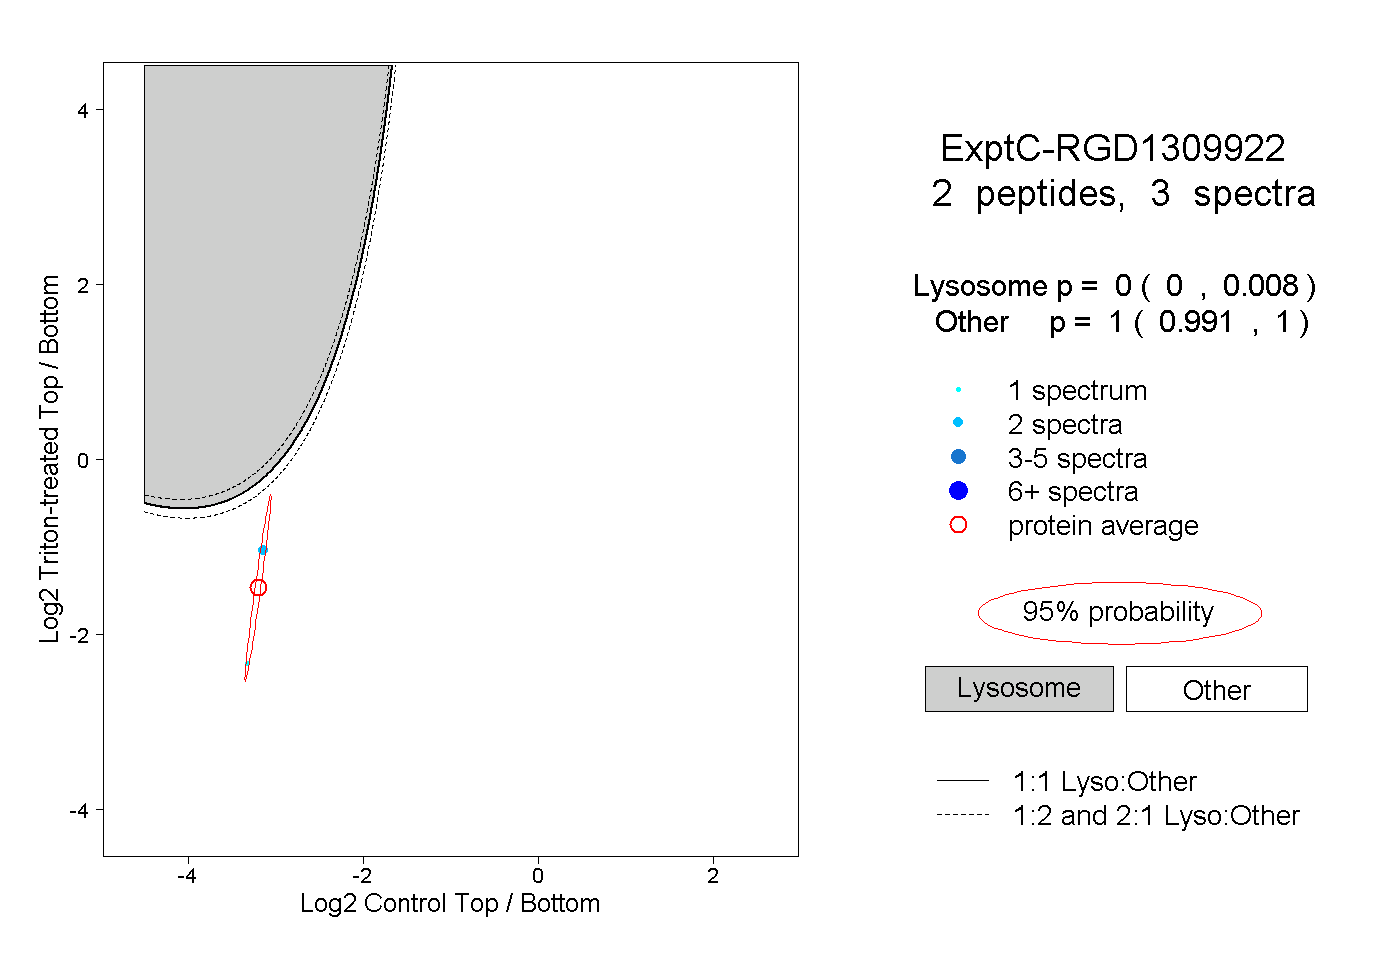
0.000 | 0.008
0.991 | 1.000