 12
12peptides
spectra
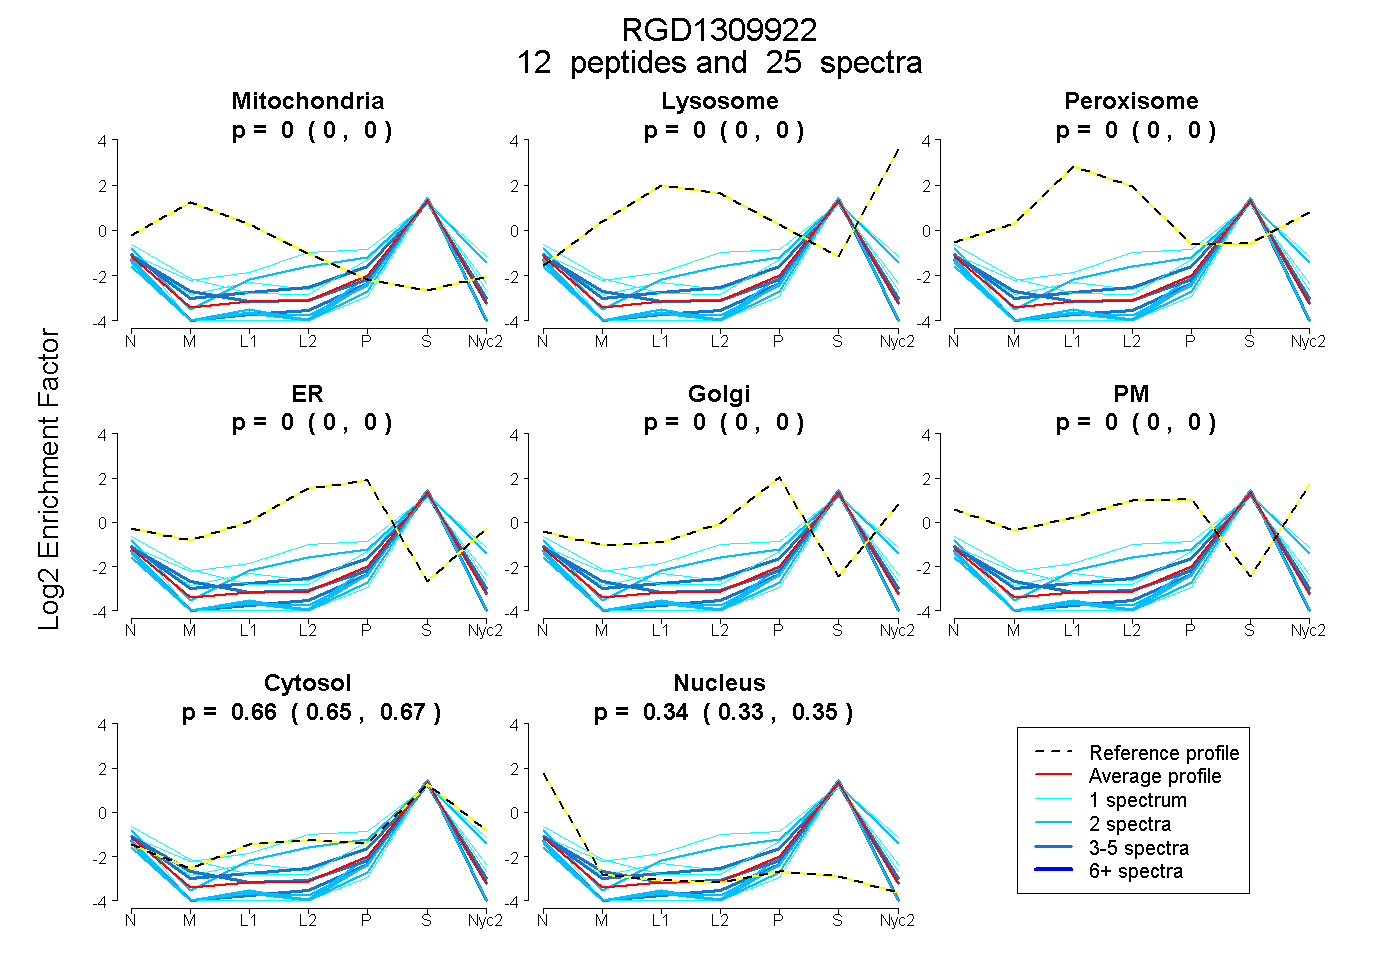
0.000 | 0.000
0.000 | 0.000
0.000 | 0.000
0.000 | 0.000
0.000 | 0.000
0.000 | 0.000
0.653 | 0.670
0.328 | 0.345
| Plot | Mito | Lyso | Perox | ER | Golgi | PM | Cytosol | Nucleus | |||||
| Expt A |
12 peptides |
25 spectra |
|
0.000 0.000 | 0.000 |
0.000 0.000 | 0.000 |
0.000 0.000 | 0.000 |
0.000 0.000 | 0.000 |
0.000 0.000 | 0.000 |
0.000 0.000 | 0.000 |
0.663 0.653 | 0.670 |
0.337 0.328 | 0.345 |
| 1 spectrum, VLLSLPEK | 0.000 | 0.000 | 0.000 | 0.000 | 0.000 | 0.000 | 0.717 | 0.283 | ||
| 1 spectrum, SDDYDSK | 0.000 | 0.000 | 0.000 | 0.066 | 0.000 | 0.000 | 0.904 | 0.029 | ||
| 2 spectra, LTPLHLEMQR | 0.000 | 0.000 | 0.000 | 0.000 | 0.000 | 0.000 | 0.586 | 0.414 | ||
| 1 spectrum, IHTLELK | 0.000 | 0.000 | 0.000 | 0.000 | 0.000 | 0.000 | 0.486 | 0.514 | ||
| 3 spectra, DDGEEEFAGAK | 0.000 | 0.000 | 0.000 | 0.000 | 0.000 | 0.000 | 0.576 | 0.424 | ||
| 5 spectra, VLLLSSPGLEEFYR | 0.000 | 0.000 | 0.000 | 0.000 | 0.000 | 0.000 | 0.653 | 0.347 | ||
| 2 spectra, LEESHNR | 0.000 | 0.000 | 0.000 | 0.000 | 0.000 | 0.000 | 0.872 | 0.128 | ||
| 1 spectrum, FAEFQYLQPGPPR | 0.000 | 0.000 | 0.000 | 0.000 | 0.000 | 0.000 | 0.765 | 0.235 | ||
| 2 spectra, VVAQNICQYR | 0.000 | 0.000 | 0.000 | 0.000 | 0.000 | 0.000 | 0.565 | 0.435 | ||
| 2 spectra, FSATEVTNK | 0.000 | 0.000 | 0.000 | 0.000 | 0.000 | 0.000 | 0.569 | 0.431 | ||
| 2 spectra, TLAAEMQELR | 0.000 | 0.000 | 0.000 | 0.000 | 0.000 | 0.000 | 0.570 | 0.430 | ||
| 3 spectra, LEETEVR | 0.000 | 0.000 | 0.000 | 0.000 | 0.000 | 0.000 | 0.717 | 0.283 |
| Plot | Mito | Lyso or Perox | ER | Golgi | PM | Cytosol | Nucleus | ||||||
| Expt B |
6 peptides |
8 spectra |
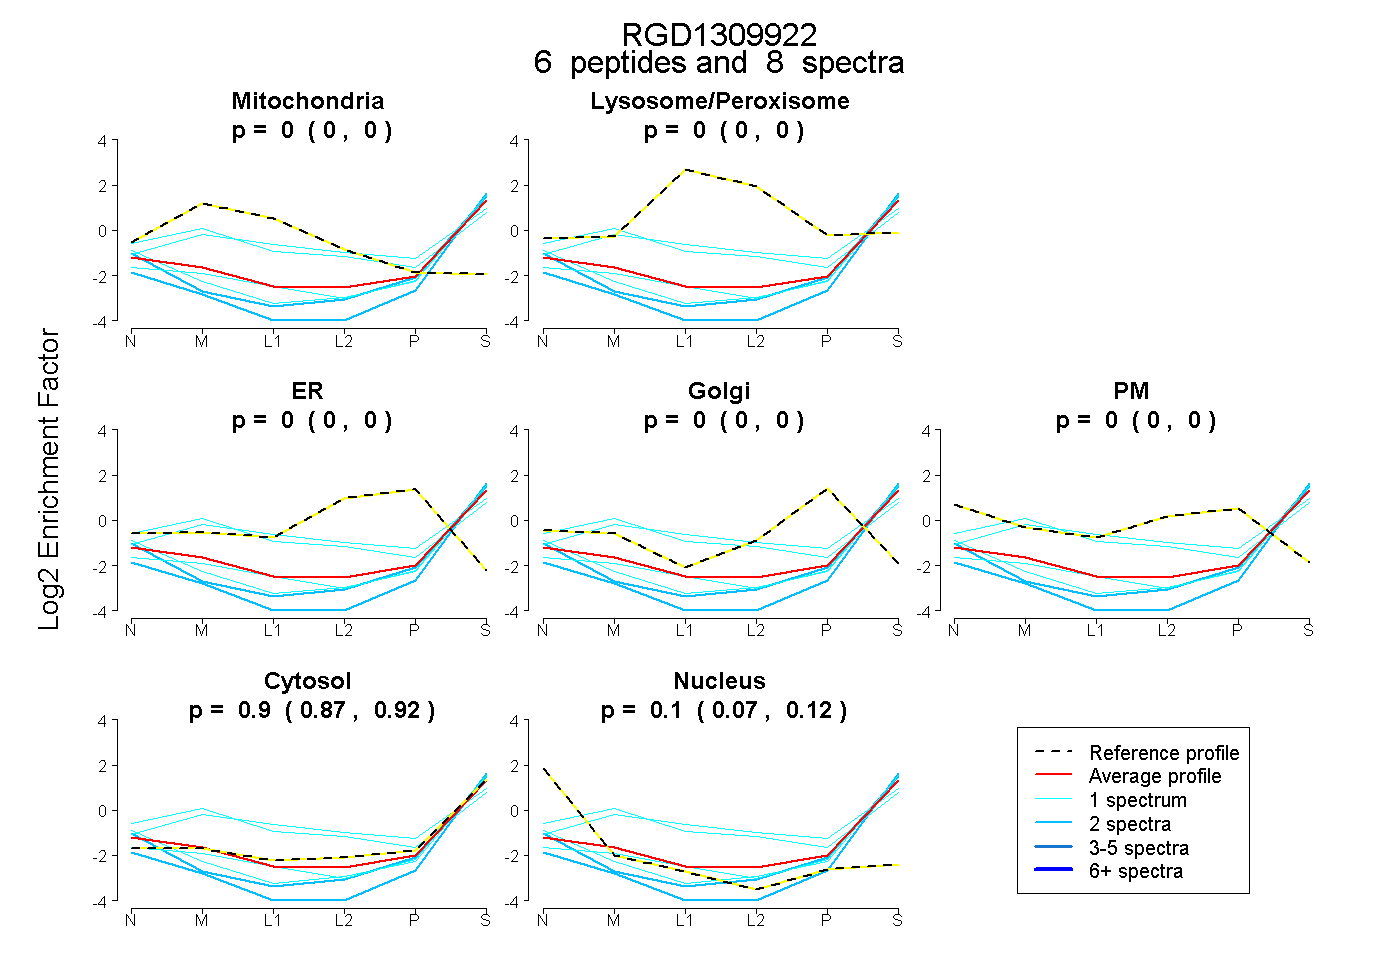 |
0.000 0.000 | 0.000 |
0.000 0.000 | 0.000 |
0.000 0.000 | 0.000 |
0.000 0.000 | 0.000 |
0.000 0.000 | 0.000 |
0.898 0.870 | 0.919 |
0.102 0.074 | 0.124 |
|||
| Plot | Lyso | Other | |||||||||||
| Expt C |
2 peptides |
3 spectra |
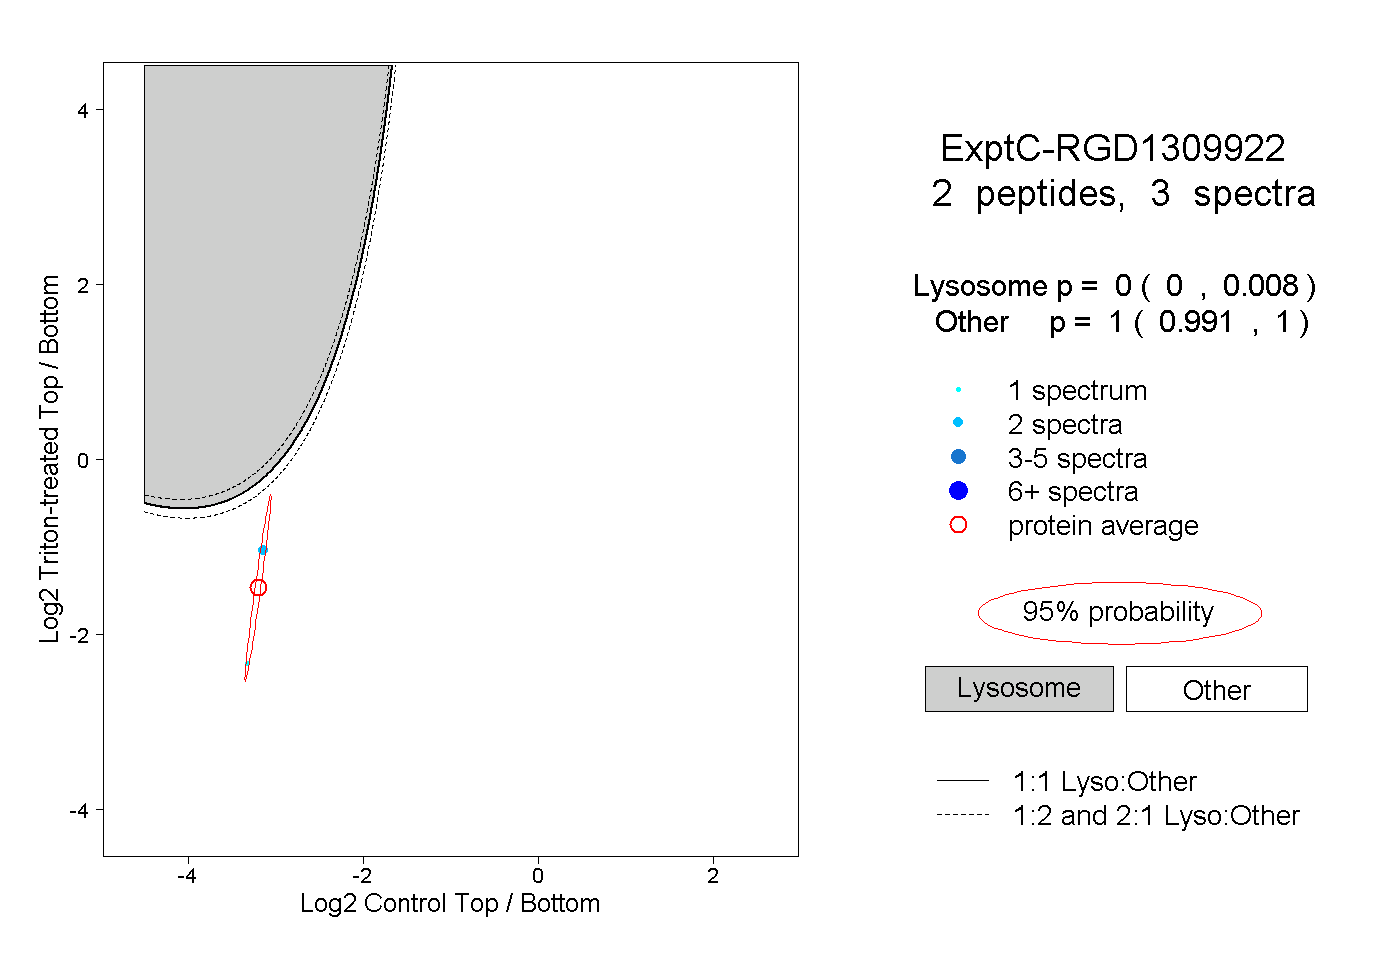 |
0.000 0.000 | 0.008 |
1.000 0.991 | 1.000 |