 14
14peptides
spectra
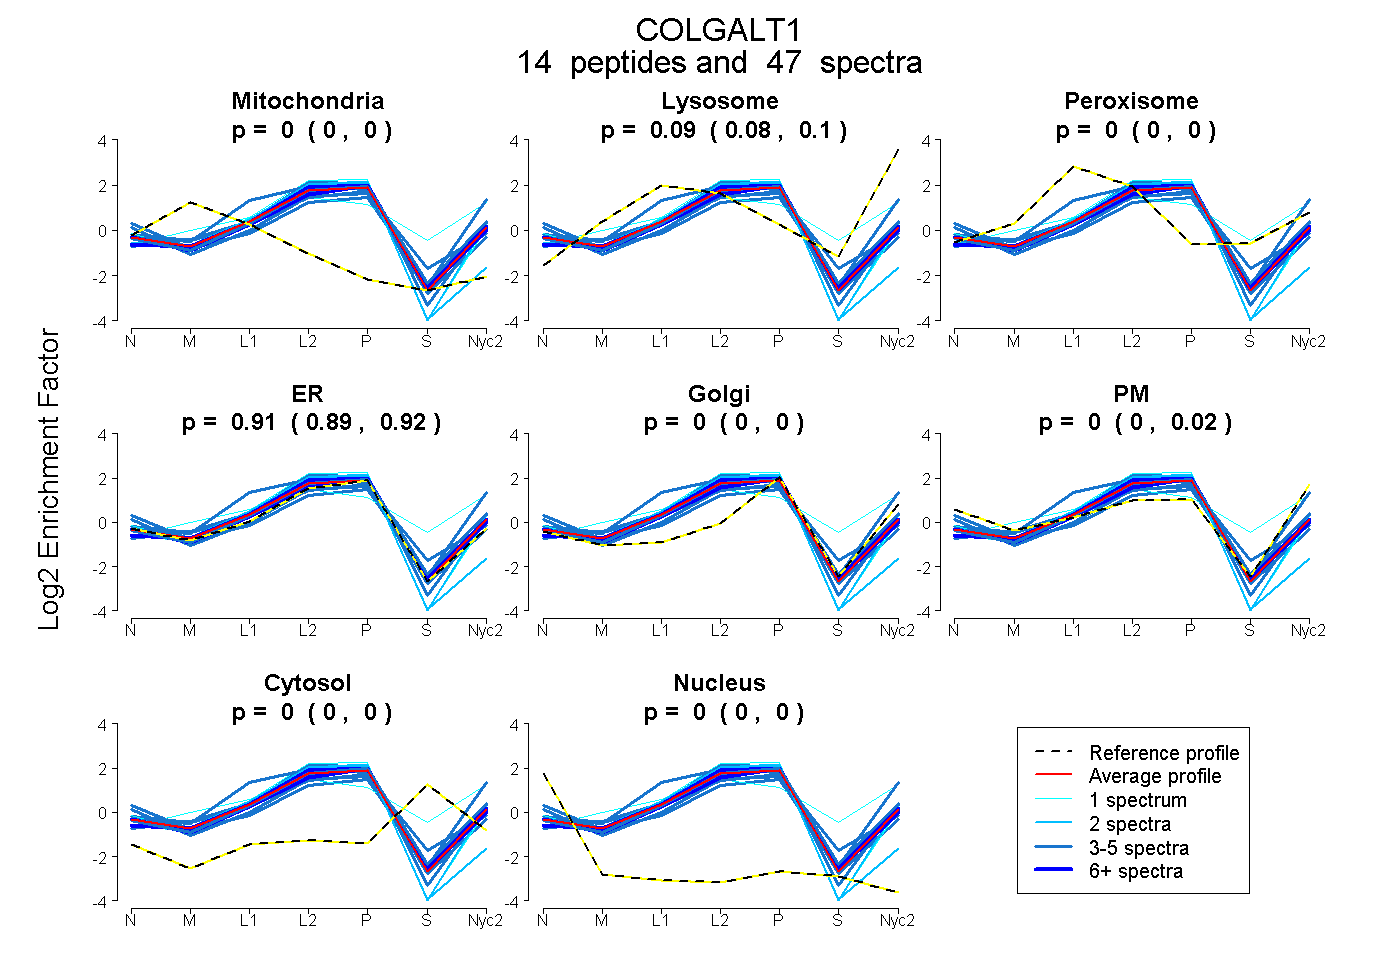
0.000 | 0.000
0.079 | 0.096
0.000 | 0.000
0.894 | 0.917
0.000 | 0.000
0.000 | 0.015
0.000 | 0.000
0.000 | 0.000
3peptides
spectra
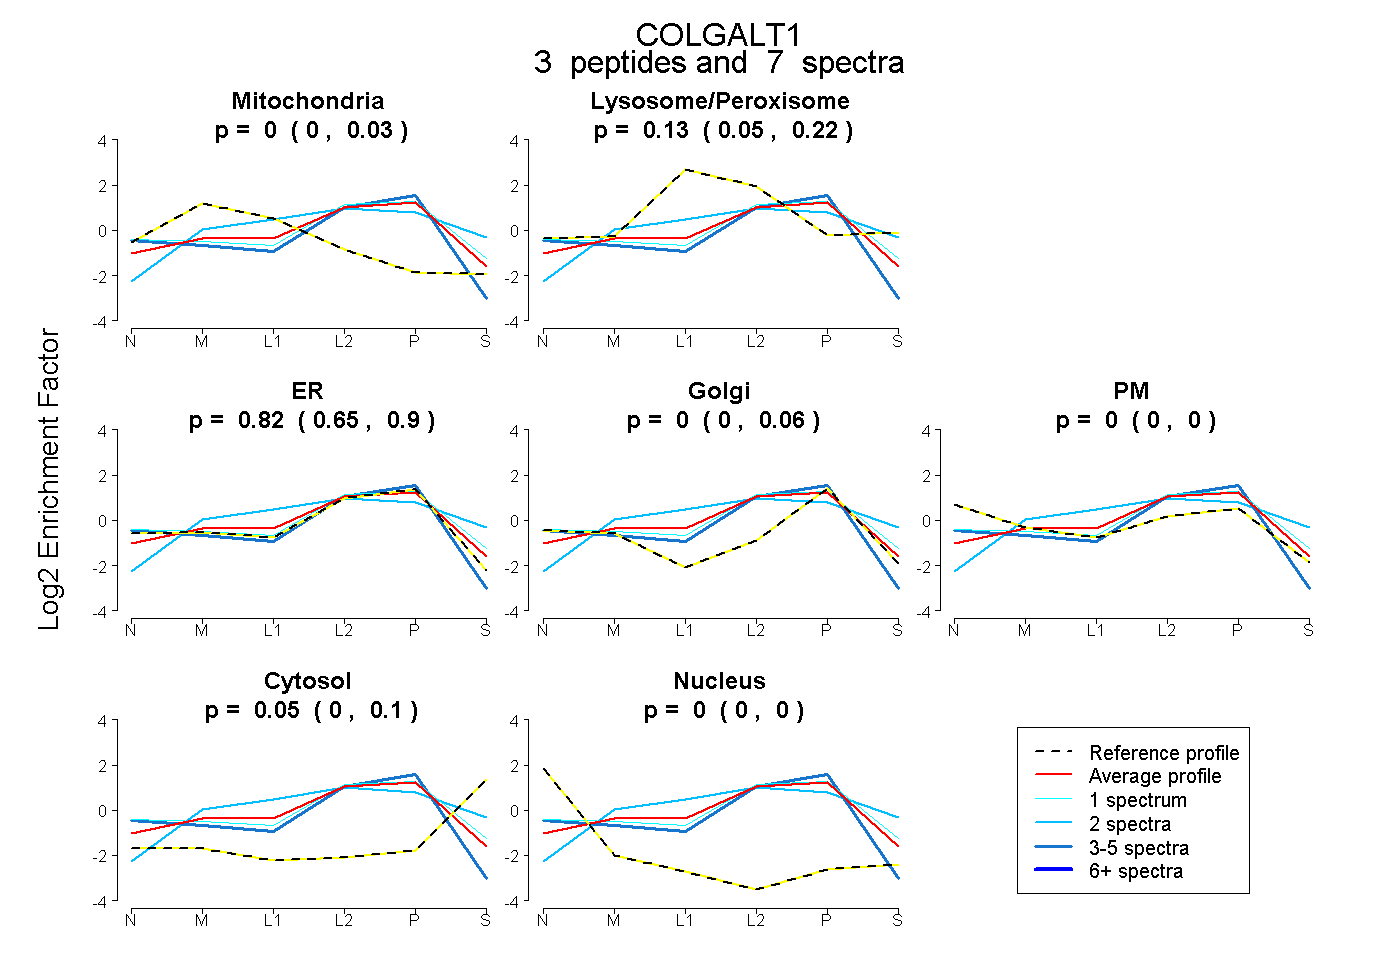
0.000 | 0.031
0.052 | 0.217
0.649 | 0.902
0.000 | 0.057
0.000 | 0.000
0.000 | 0.100
0.000 | 0.000
20peptides
spectra
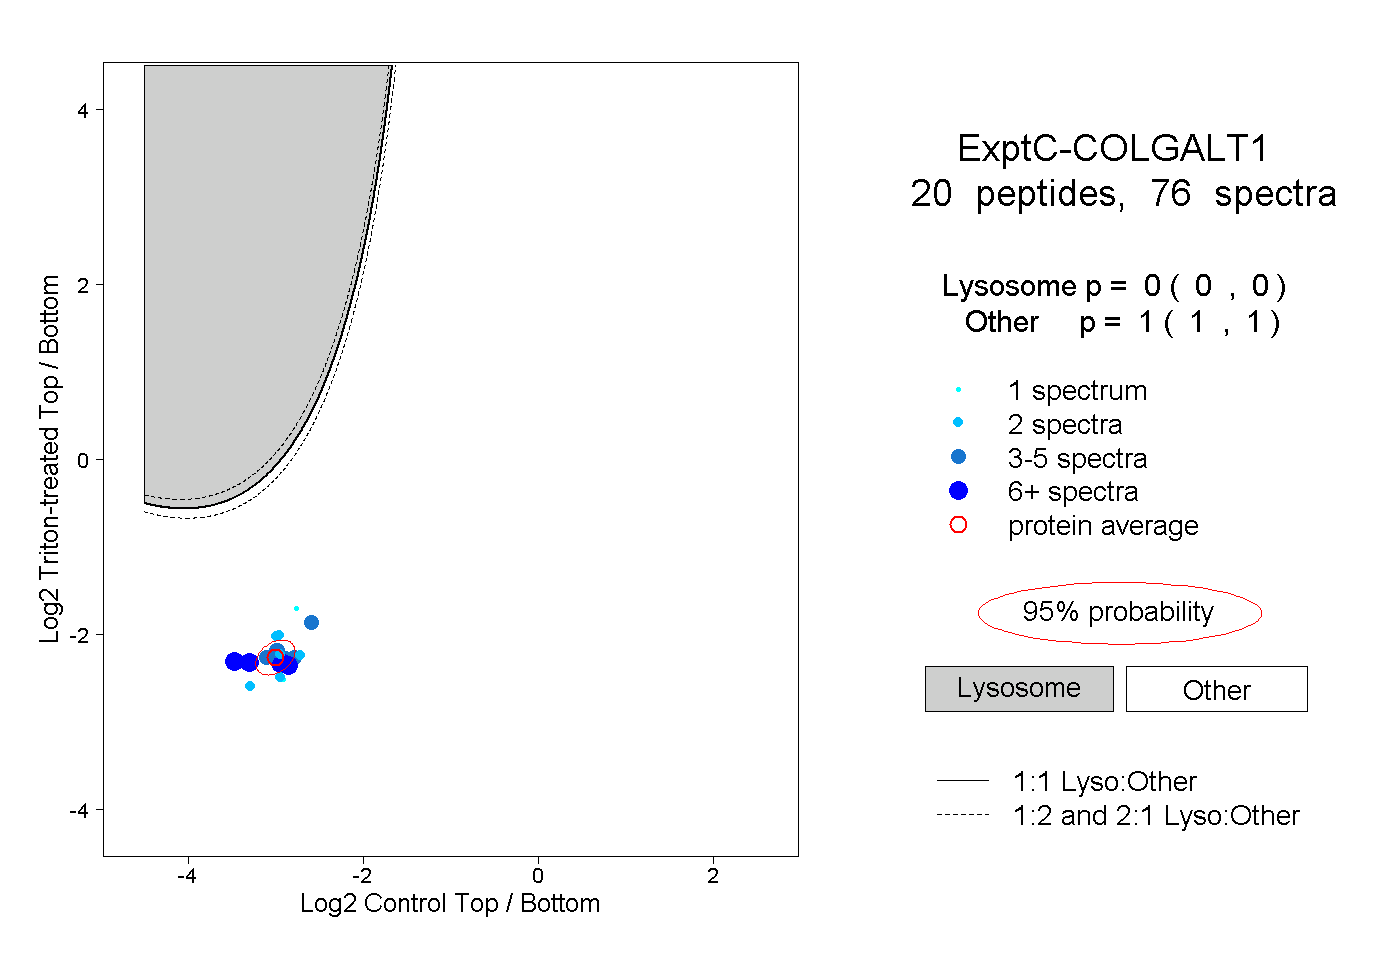
0.000 | 0.000
1.000 | 1.000
2peptides
spectra
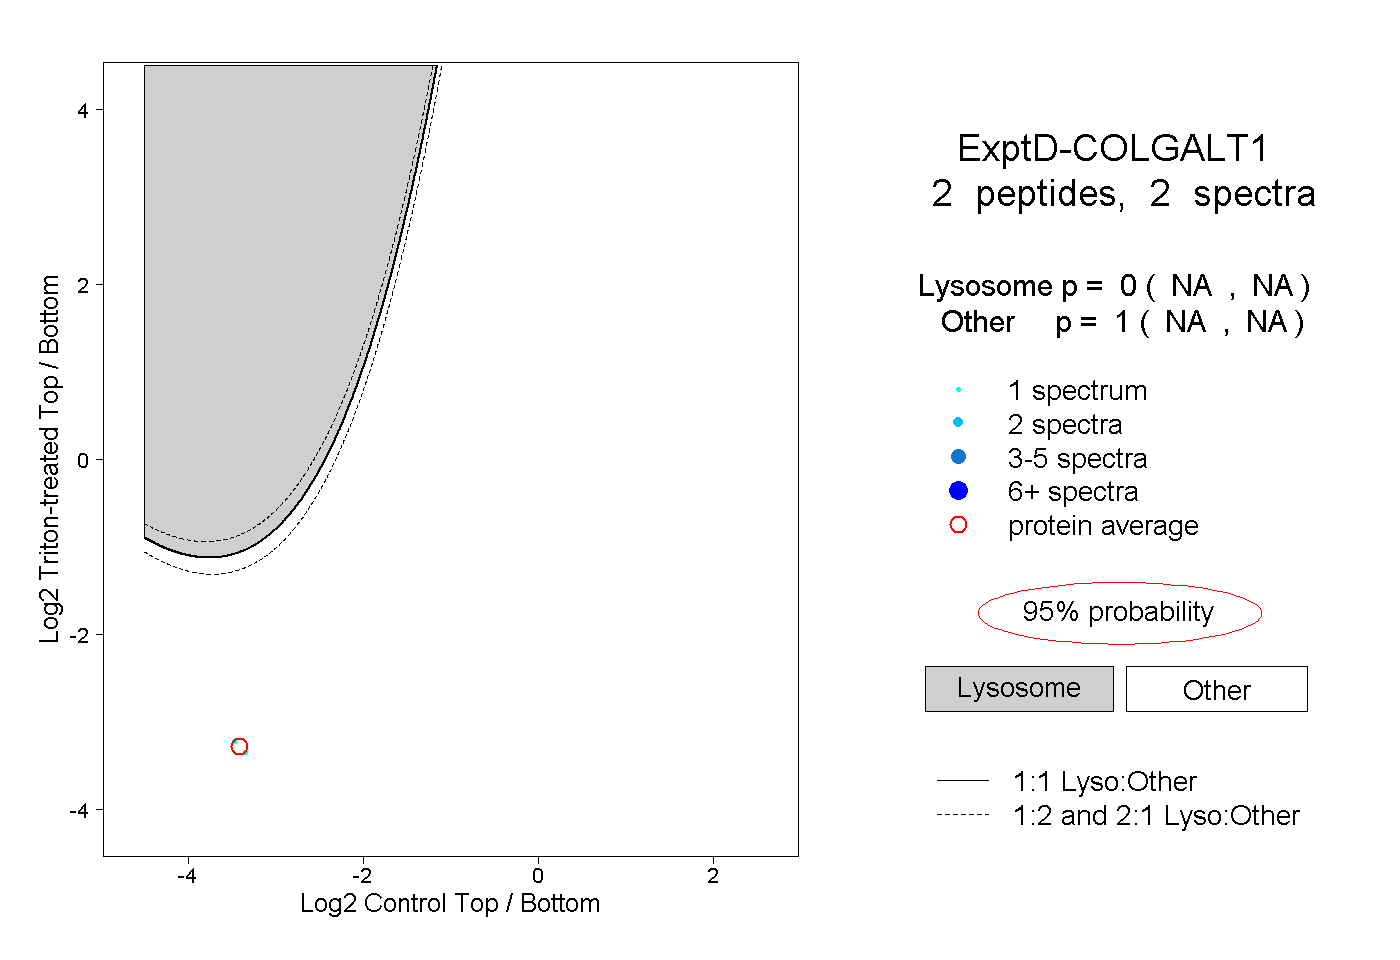
NA | NA
NA | NA