 14
14peptides
spectra
0.000 | 0.000
0.079 | 0.096
0.000 | 0.000
0.894 | 0.917
0.000 | 0.000
0.000 | 0.015
0.000 | 0.000
0.000 | 0.000
| Plot | Mito | Lyso | Perox | ER | Golgi | PM | Cytosol | Nucleus | |||||
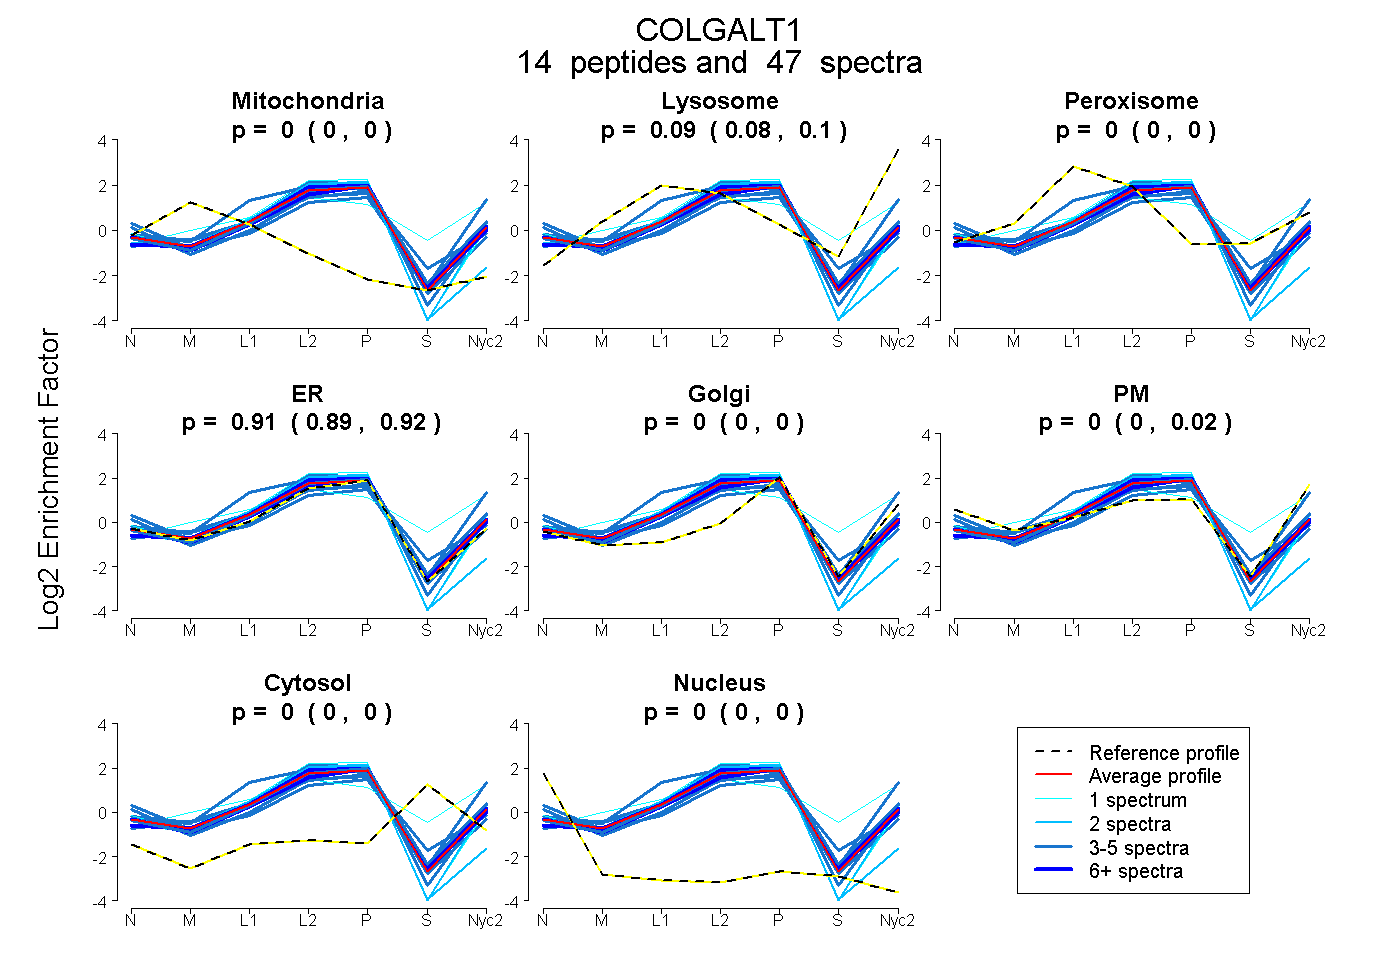
| Expt A |
14 peptides |
47 spectra |
|
0.000 0.000 | 0.000 |
0.089 0.079 | 0.096 |
0.000 0.000 | 0.000 |
0.911 0.894 | 0.917 |
0.000 0.000 | 0.000 |
0.000 0.000 | 0.015 |
0.000 0.000 | 0.000 |
0.000 0.000 | 0.000 |
| 2 spectra, QAEVQMYVCNK | 0.013 | 0.000 | 0.000 | 0.984 | 0.000 | 0.000 | 0.000 | 0.004 | ||
| 5 spectra, EQQALSR | 0.000 | 0.000 | 0.000 | 0.646 | 0.000 | 0.297 | 0.004 | 0.053 | ||
| 6 spectra, TVVAPMLDSR | 0.000 | 0.103 | 0.000 | 0.897 | 0.000 | 0.000 | 0.000 | 0.000 | ||
| 4 spectra, LMNLMQDVER | 0.000 | 0.108 | 0.000 | 0.892 | 0.000 | 0.000 | 0.000 | 0.000 | ||
| 5 spectra, NSDVLQSPLDSTAR | 0.000 | 0.344 | 0.000 | 0.598 | 0.000 | 0.058 | 0.000 | 0.000 | ||
| 1 spectrum, EWLVAVK | 0.000 | 0.362 | 0.138 | 0.328 | 0.043 | 0.000 | 0.129 | 0.000 | ||
| 6 spectra, TPAYIPIR | 0.000 | 0.047 | 0.000 | 0.953 | 0.000 | 0.000 | 0.000 | 0.000 | ||
| 2 spectra, SLVFEDDLR | 0.000 | 0.037 | 0.000 | 0.963 | 0.000 | 0.000 | 0.000 | 0.000 | ||
| 1 spectrum, EGLDWDLIYVGR | 0.000 | 0.000 | 0.000 | 0.987 | 0.000 | 0.013 | 0.000 | 0.000 | ||
| 3 spectra, HPPVQLSR | 0.054 | 0.000 | 0.016 | 0.899 | 0.000 | 0.031 | 0.000 | 0.000 | ||
| 1 spectrum, MGFDEVFMINLK | 0.000 | 0.000 | 0.000 | 0.968 | 0.000 | 0.032 | 0.000 | 0.000 | ||
| 1 spectrum, NAAPALPATLGALER | 0.000 | 0.005 | 0.000 | 0.995 | 0.000 | 0.000 | 0.000 | 0.000 | ||
| 5 spectra, MQVEHPEK | 0.000 | 0.000 | 0.044 | 0.767 | 0.000 | 0.090 | 0.100 | 0.000 | ||
| 5 spectra, WSPESPLQAPR | 0.000 | 0.129 | 0.000 | 0.871 | 0.000 | 0.000 | 0.000 | 0.000 |
| Plot | Mito | Lyso or Perox | ER | Golgi | PM | Cytosol | Nucleus | ||||||
| Expt B |
3 peptides |
7 spectra |
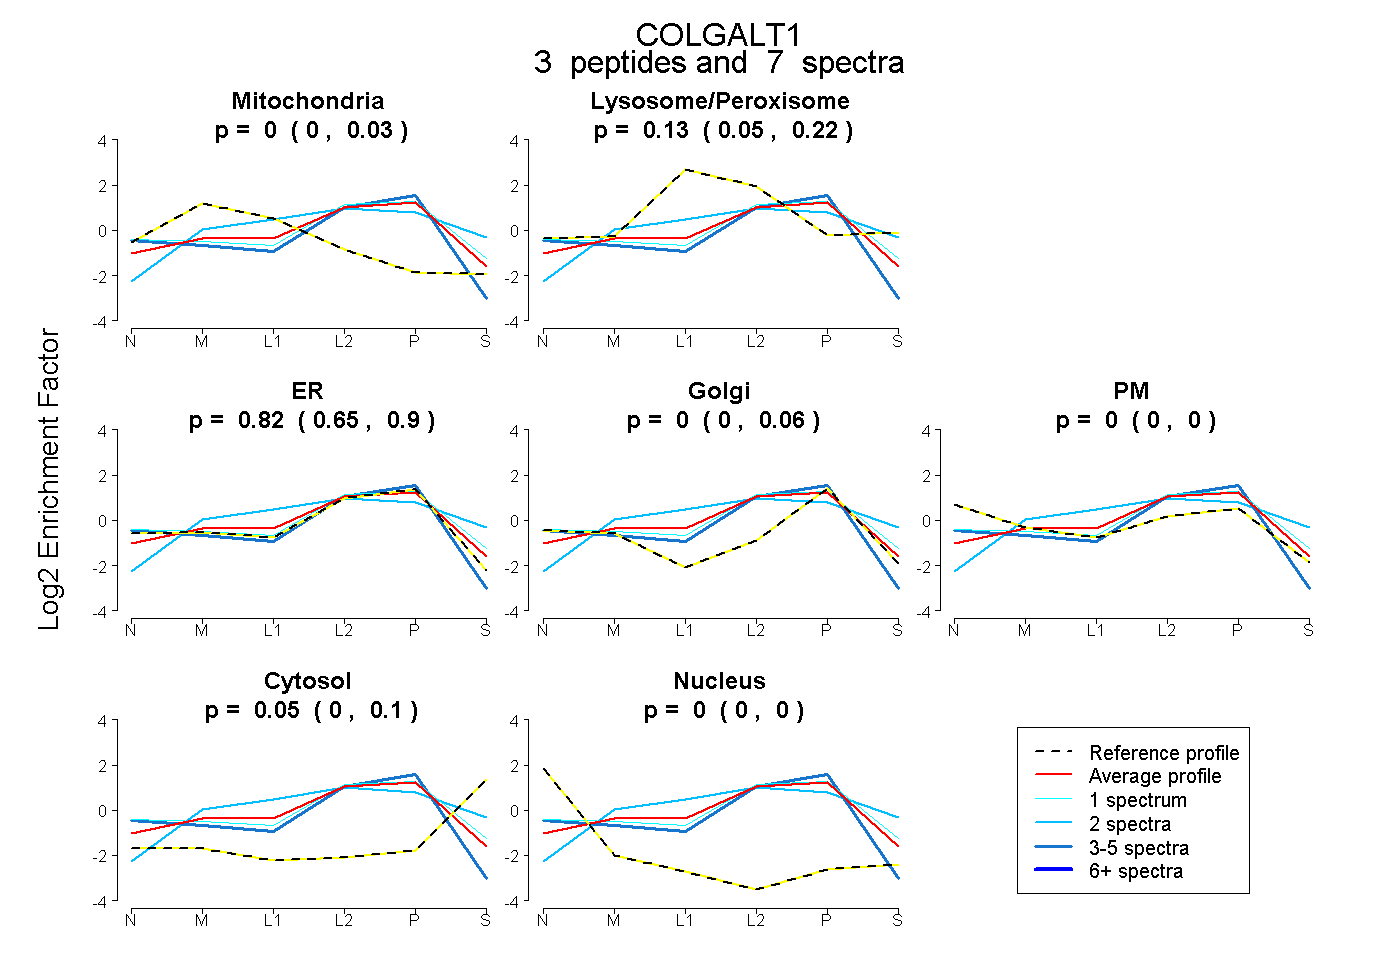 |
0.000 0.000 | 0.031 |
0.135 0.052 | 0.217 |
0.817 0.649 | 0.902 |
0.000 0.000 | 0.057 |
0.000 0.000 | 0.000 |
0.048 0.000 | 0.100 |
0.000 0.000 | 0.000 |
|||
| Plot | Lyso | Other | |||||||||||
| Expt C |
20 peptides |
76 spectra |
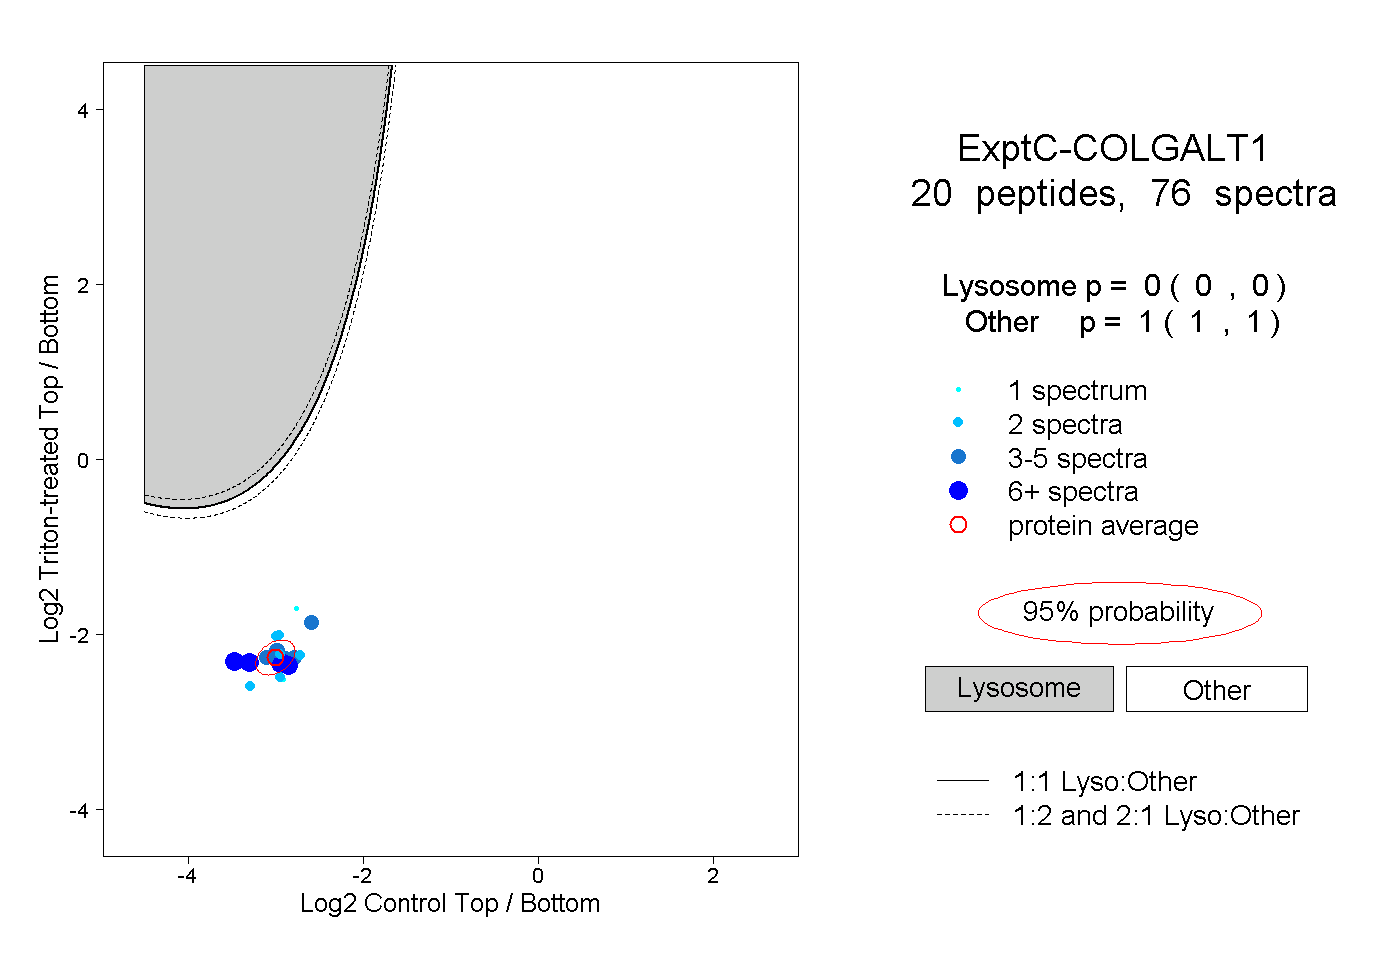 |
0.000 0.000 | 0.000 |
1.000 1.000 | 1.000 |
||||||||
| Plot | Lyso | Other | |||||||||||
| Expt D |
2 peptides |
2 spectra |
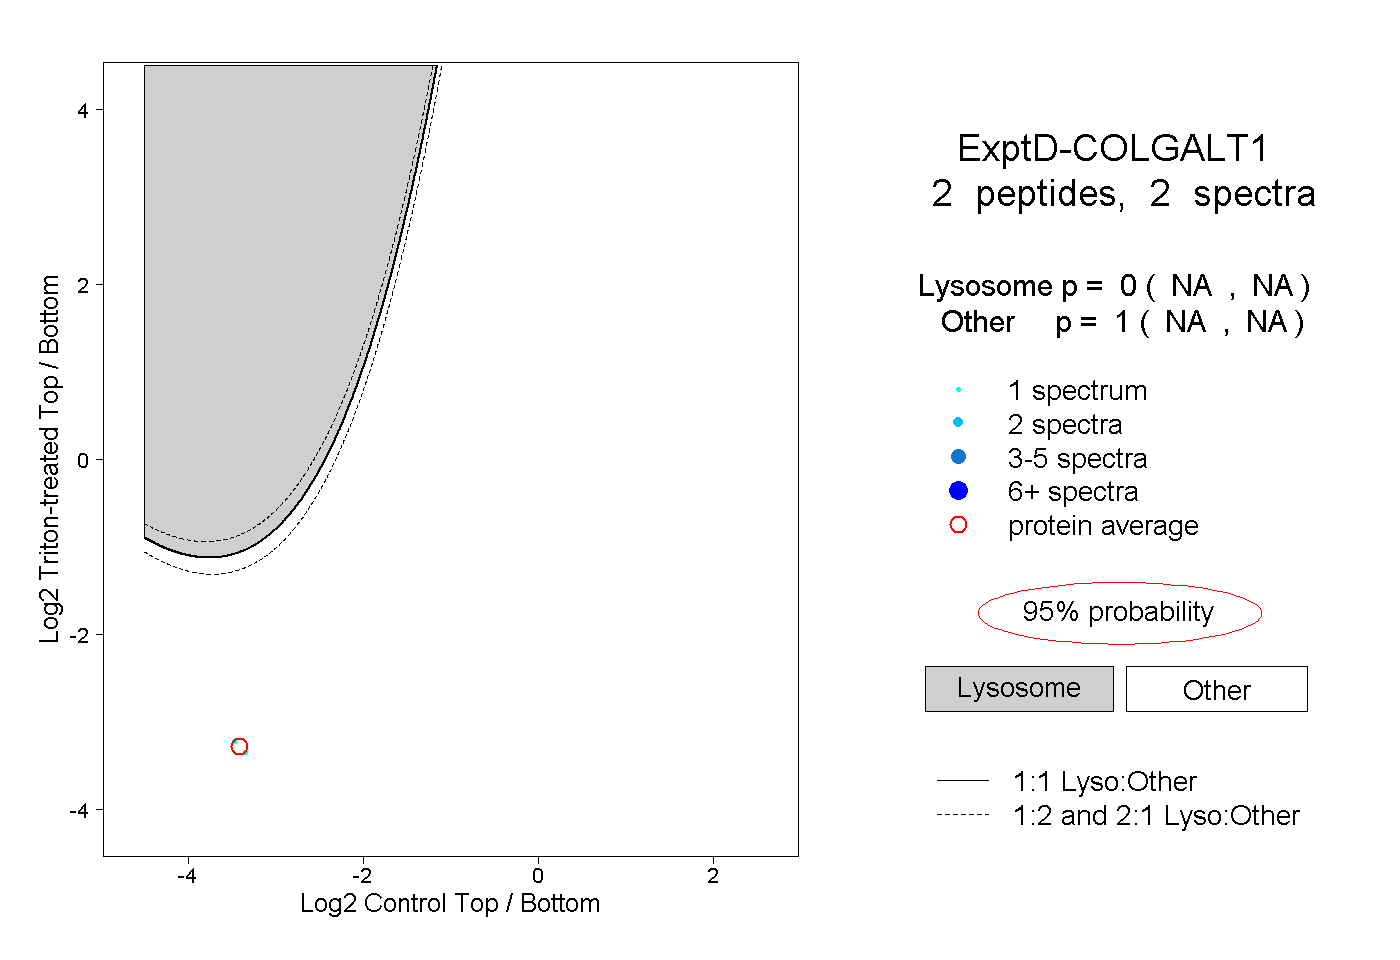 |
0.000 NA | NA |
1.000 NA | NA |