 7
7peptides
spectra
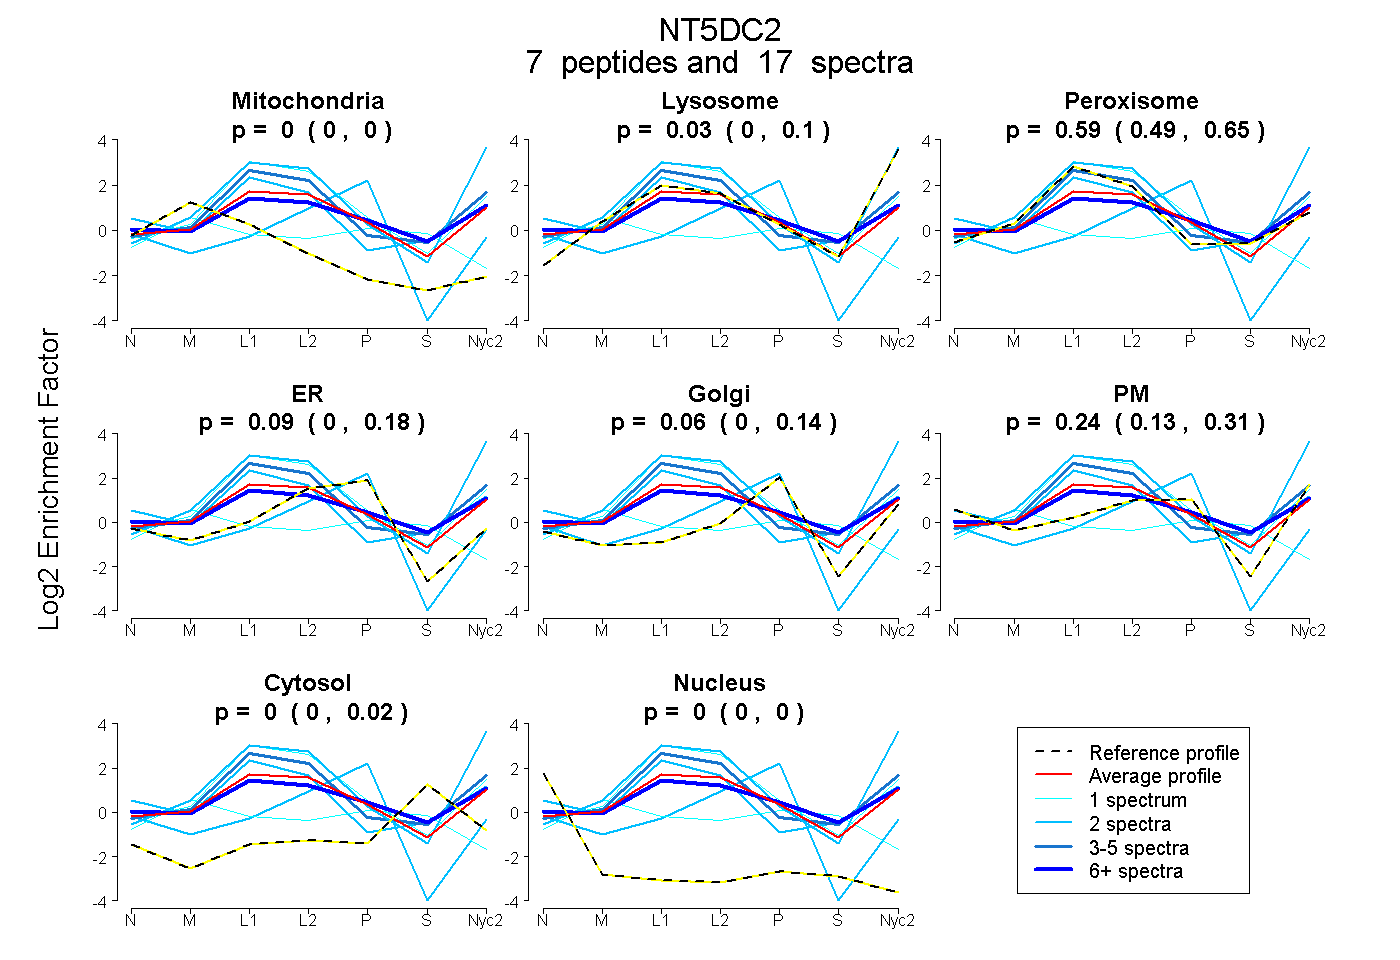
0.000 | 0.001
0.000 | 0.101
0.495 | 0.650
0.000 | 0.182
0.000 | 0.140
0.133 | 0.308
0.000 | 0.024
0.000 | 0.000
15peptides
spectra
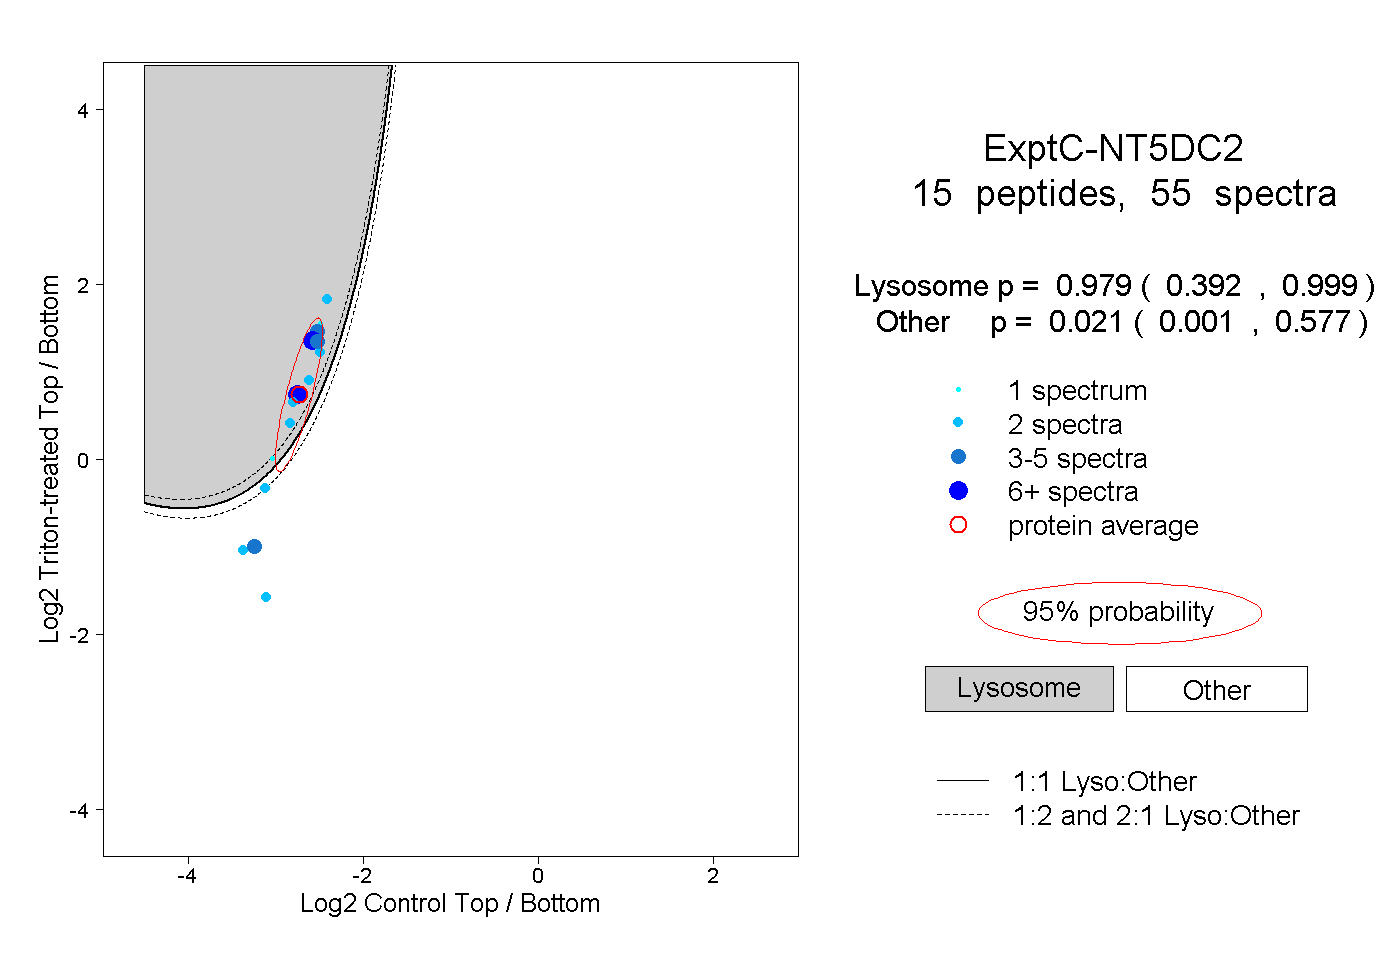
0.392 | 0.999
0.001 | 0.577
3peptides
spectra
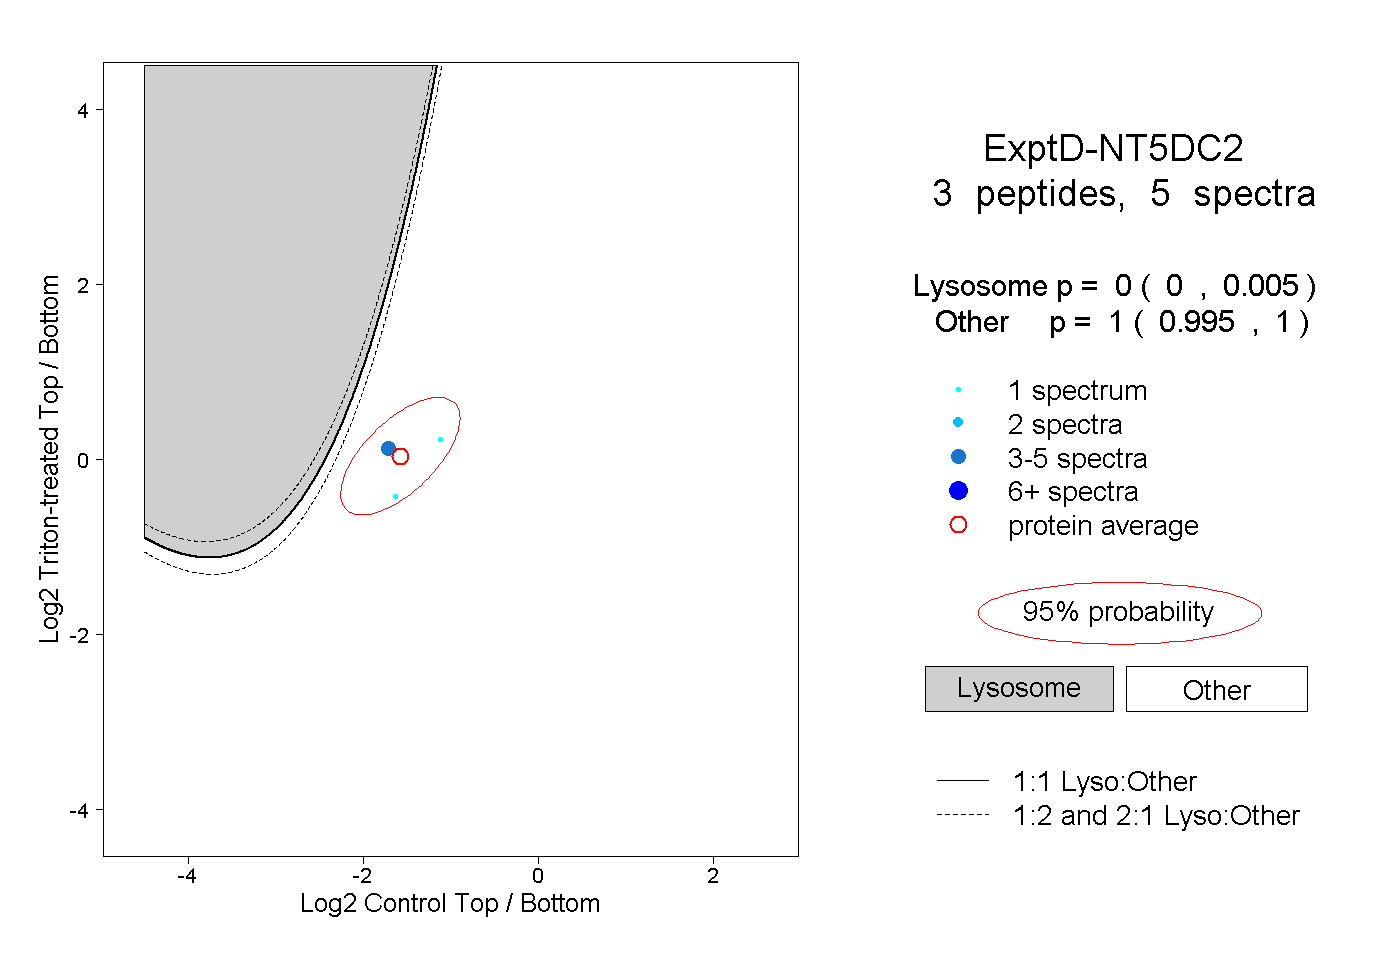
0.000 | 0.005
0.995 | 1.000