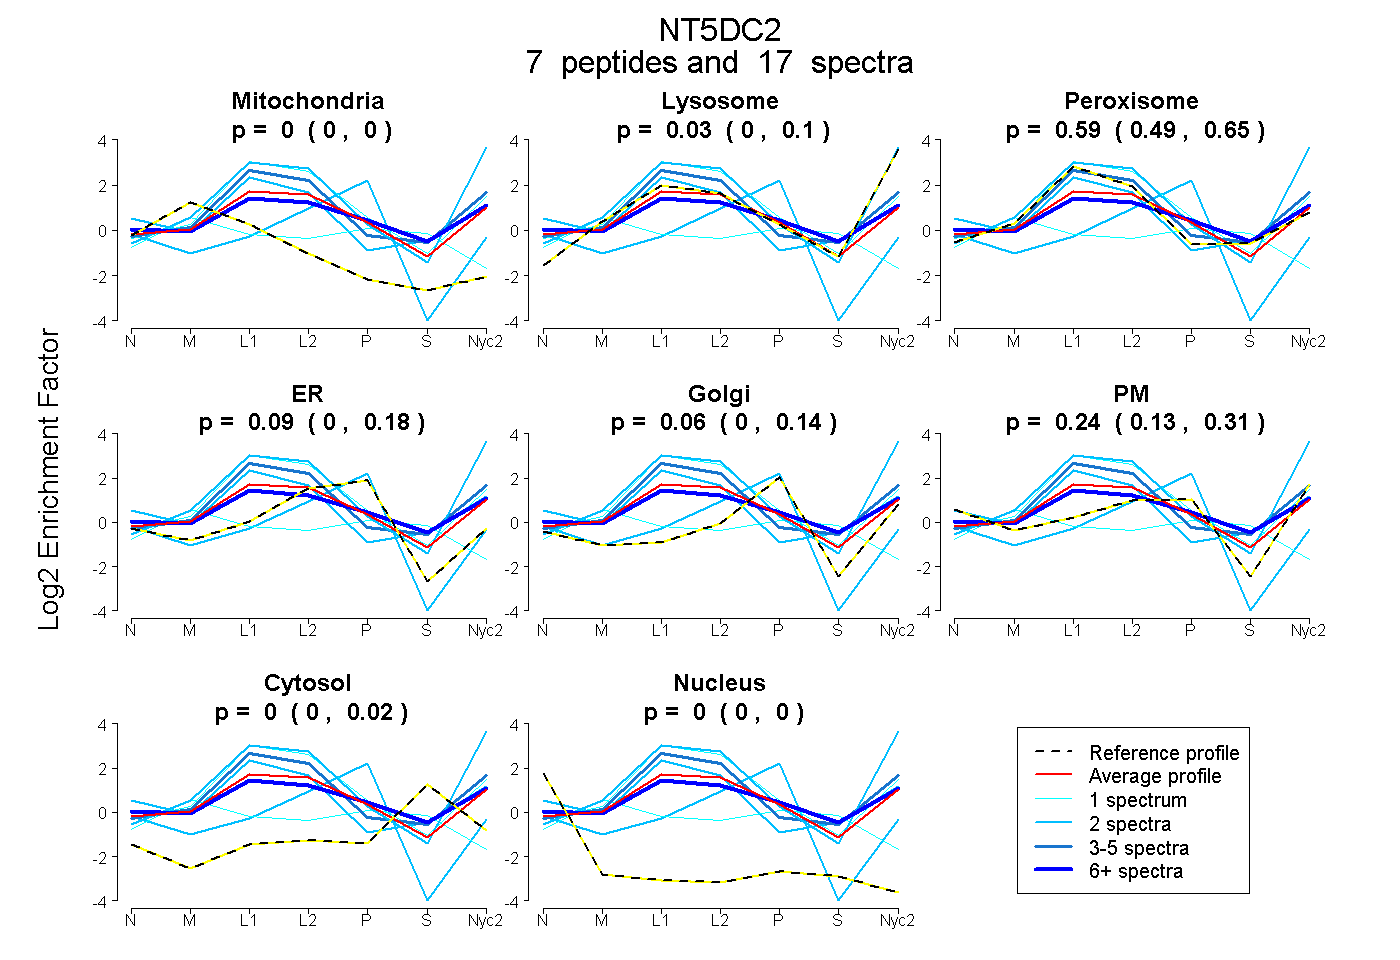
 7
7peptides
spectra
0.000 | 0.001
0.000 | 0.101
0.495 | 0.650
0.000 | 0.182
0.000 | 0.140
0.133 | 0.308
0.000 | 0.024
0.000 | 0.000
15peptides
spectra
0.392 | 0.999
0.001 | 0.577
| Plot | Mito | Lyso | Perox | ER | Golgi | PM | Cytosol | Nucleus | |||||
| Expt A |
7 peptides |
17 spectra |
|
0.000 0.000 | 0.001 |
0.031 0.000 | 0.101 |
0.590 0.495 | 0.650 |
0.087 0.000 | 0.182 |
0.057 0.000 | 0.140 |
0.236 0.133 | 0.308 |
0.000 0.000 | 0.024 |
0.000 0.000 | 0.000 |
||
| Plot | Lyso | Other | |||||||||||
| Expt C |
15 peptides |
55 spectra |
|
0.979 0.392 | 0.999 |
0.021 0.001 | 0.577 |
| 2 spectra, GDETFAVLSR | 0.927 | 0.073 | ||||||||
| 3 spectra, TPFLGDMAHIR | 0.001 | 0.999 | ||||||||
| 2 spectra, IDAFHYVQLGTAYR | 0.194 | 0.806 | ||||||||
| 2 spectra, QGNLFDFLR | 0.998 | 0.002 | ||||||||
| 1 spectrum, GLHYDIQK | 0.757 | 0.243 | ||||||||
| 2 spectra, GSLHWDR | 0.000 | 1.000 | ||||||||
| 2 spectra, YPEGIR | 0.983 | 0.017 | ||||||||
| 2 spectra, YDYDPSFAIR | 0.961 | 0.039 | ||||||||
| 4 spectra, TGAIIPELER | 0.994 | 0.006 | ||||||||
| 2 spectra, QVLATWMK | 0.973 | 0.027 | ||||||||
| 12 spectra, MQTYQDAESR | 0.998 | 0.002 | ||||||||
| 14 spectra, DVTDAIR | 0.984 | 0.016 | ||||||||
| 1 spectrum, ALFNAQFGSIFR | 0.998 | 0.002 | ||||||||
| 4 spectra, DILIEHYK | 0.998 | 0.002 | ||||||||
| 2 spectra, HMVGPDWR | 0.001 | 0.999 |
| Plot | Lyso | Other | |||||||||||
| Expt D |
3 peptides |
5 spectra |
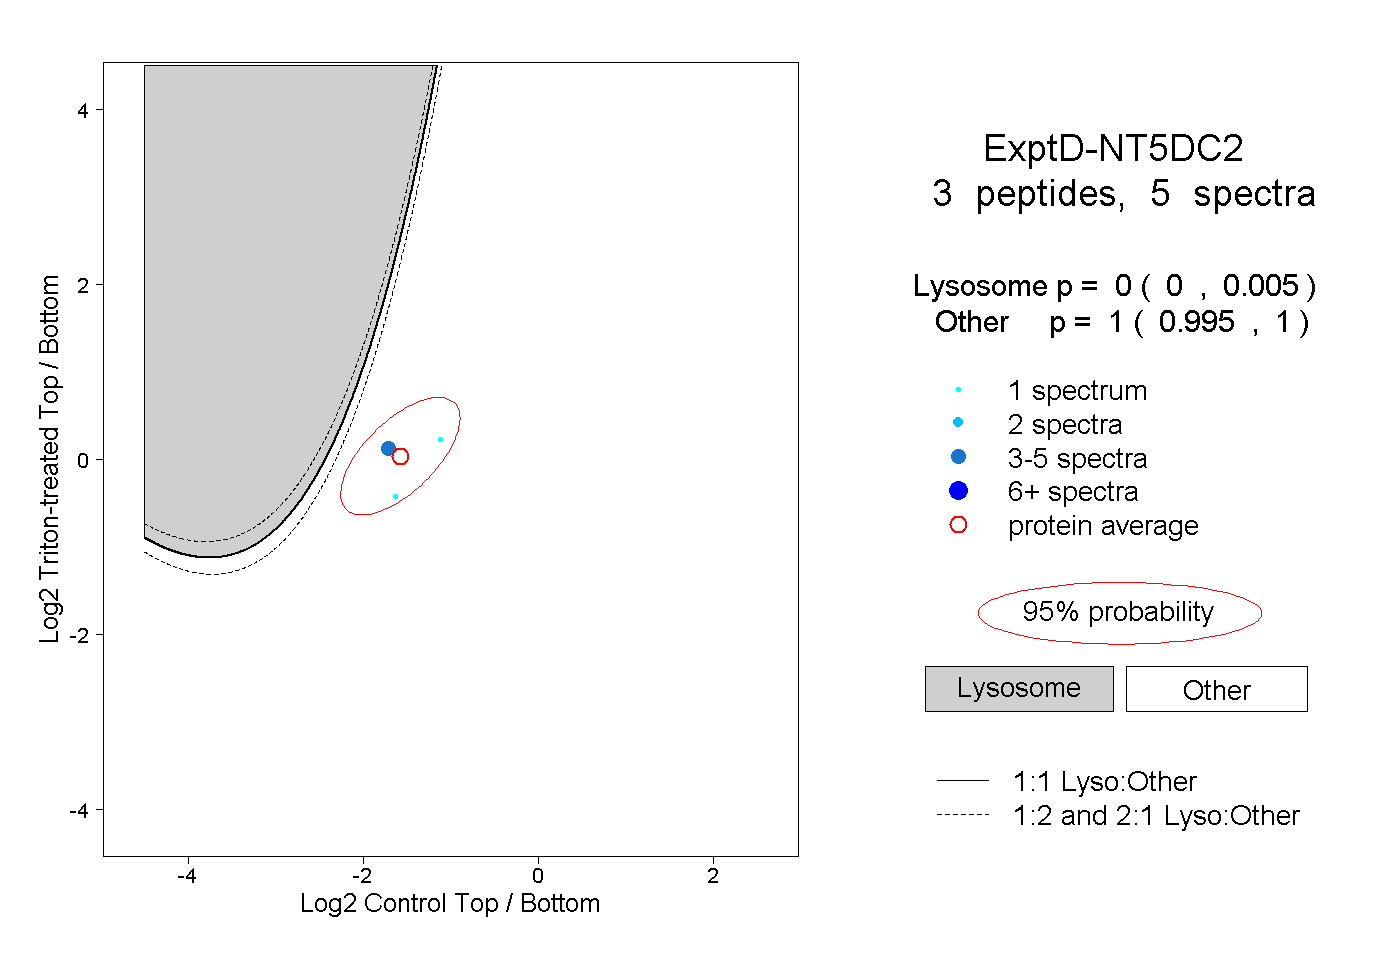 |
0.000 0.000 | 0.005 |
1.000 0.995 | 1.000 |