 17
17peptides
spectra
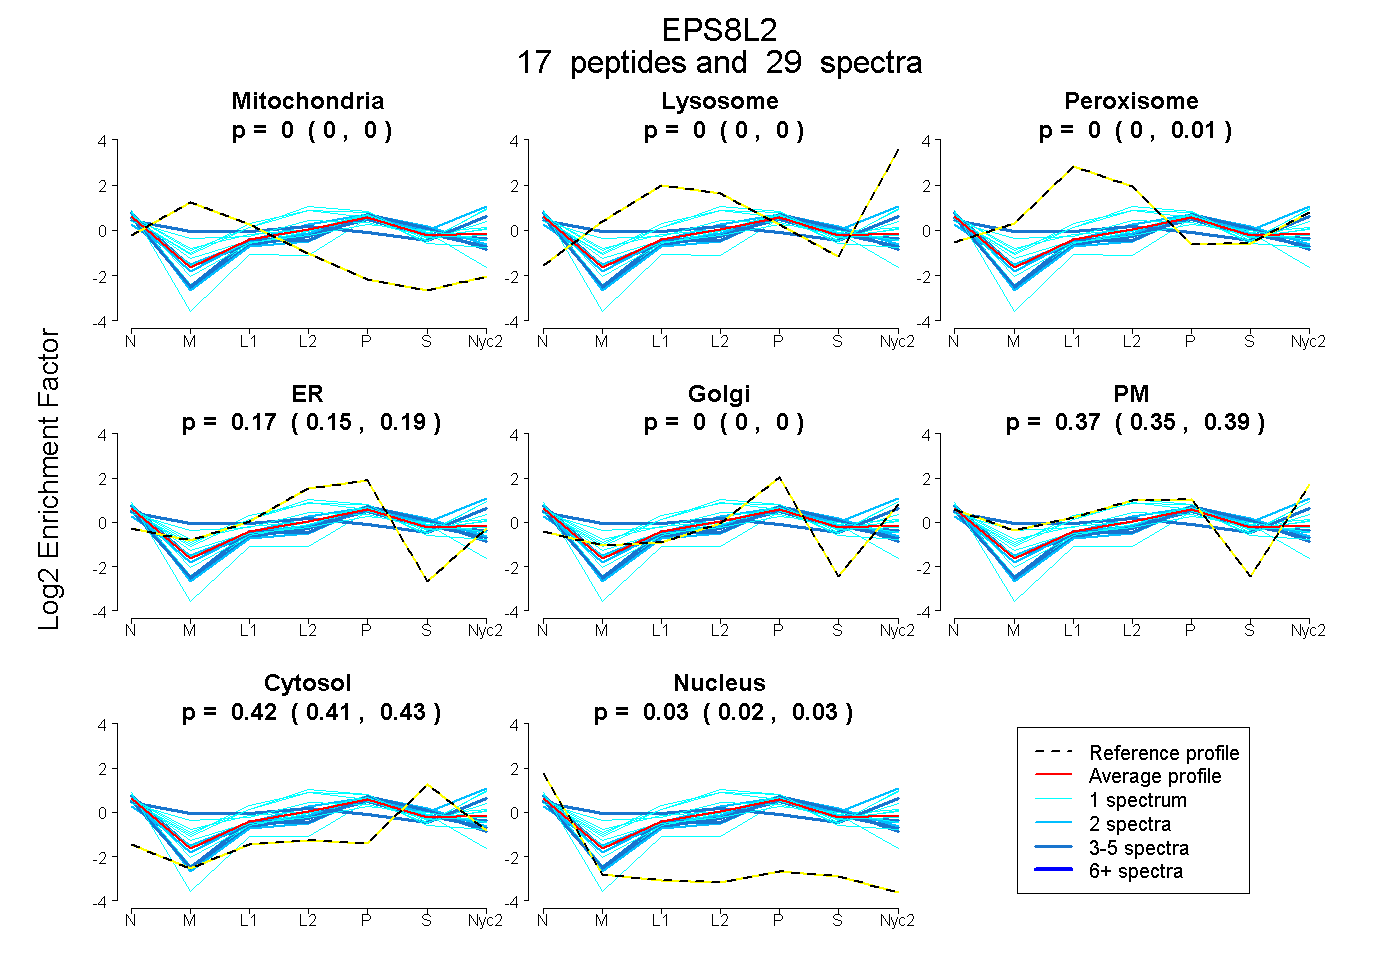
0.000 | 0.000
0.000 | 0.000
0.000 | 0.009
0.151 | 0.190
0.000 | 0.000
0.347 | 0.394
0.415 | 0.428
0.024 | 0.034
5peptides
spectra
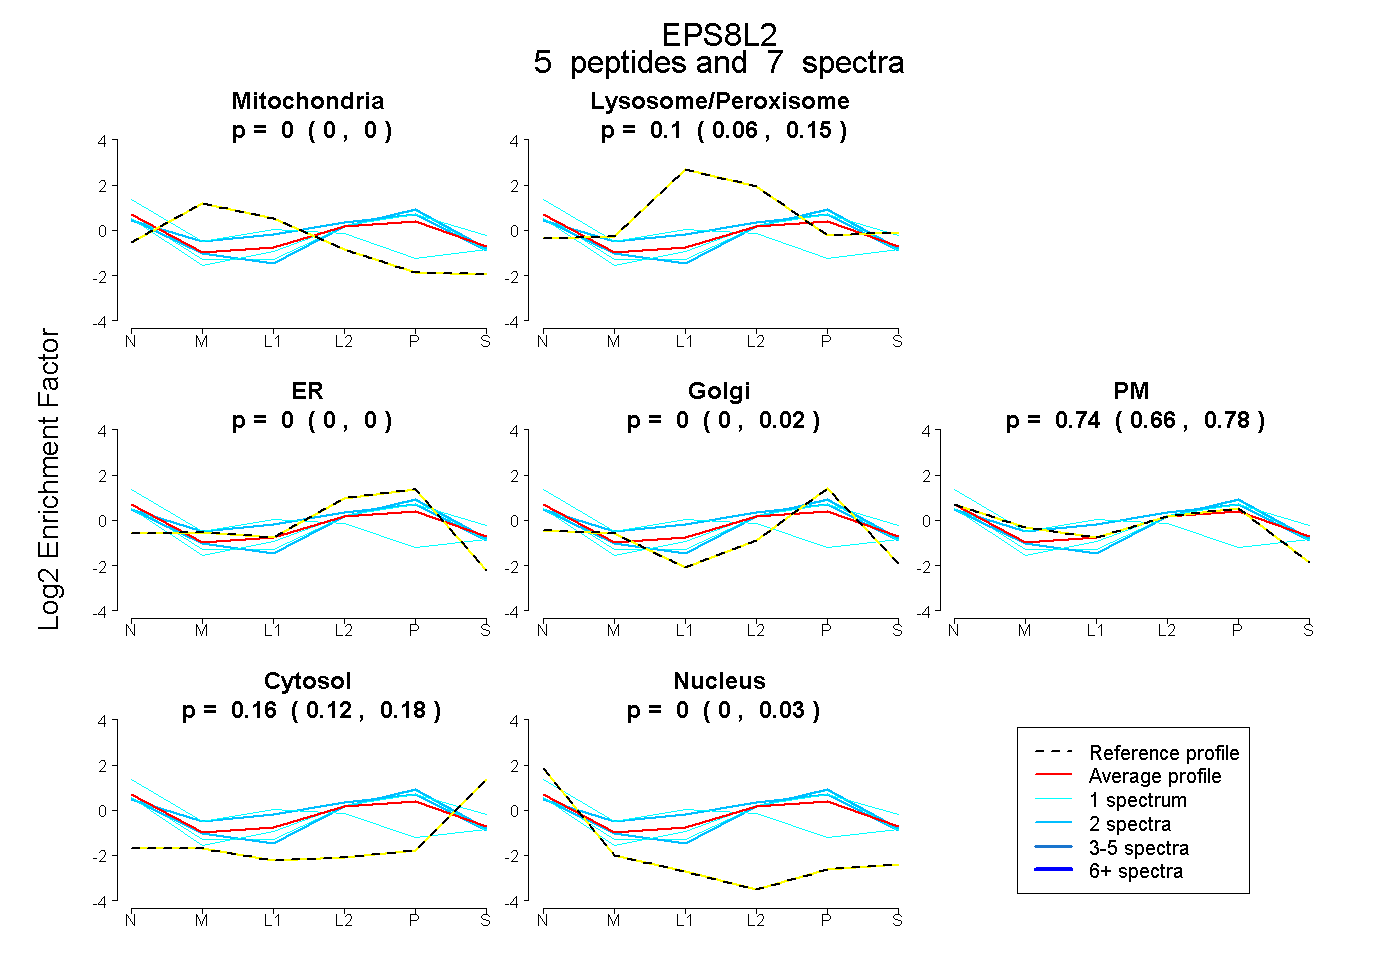
0.000 | 0.000
0.061 | 0.146
0.000 | 0.000
0.000 | 0.018
0.655 | 0.779
0.123 | 0.178
0.000 | 0.027
14peptides
spectra
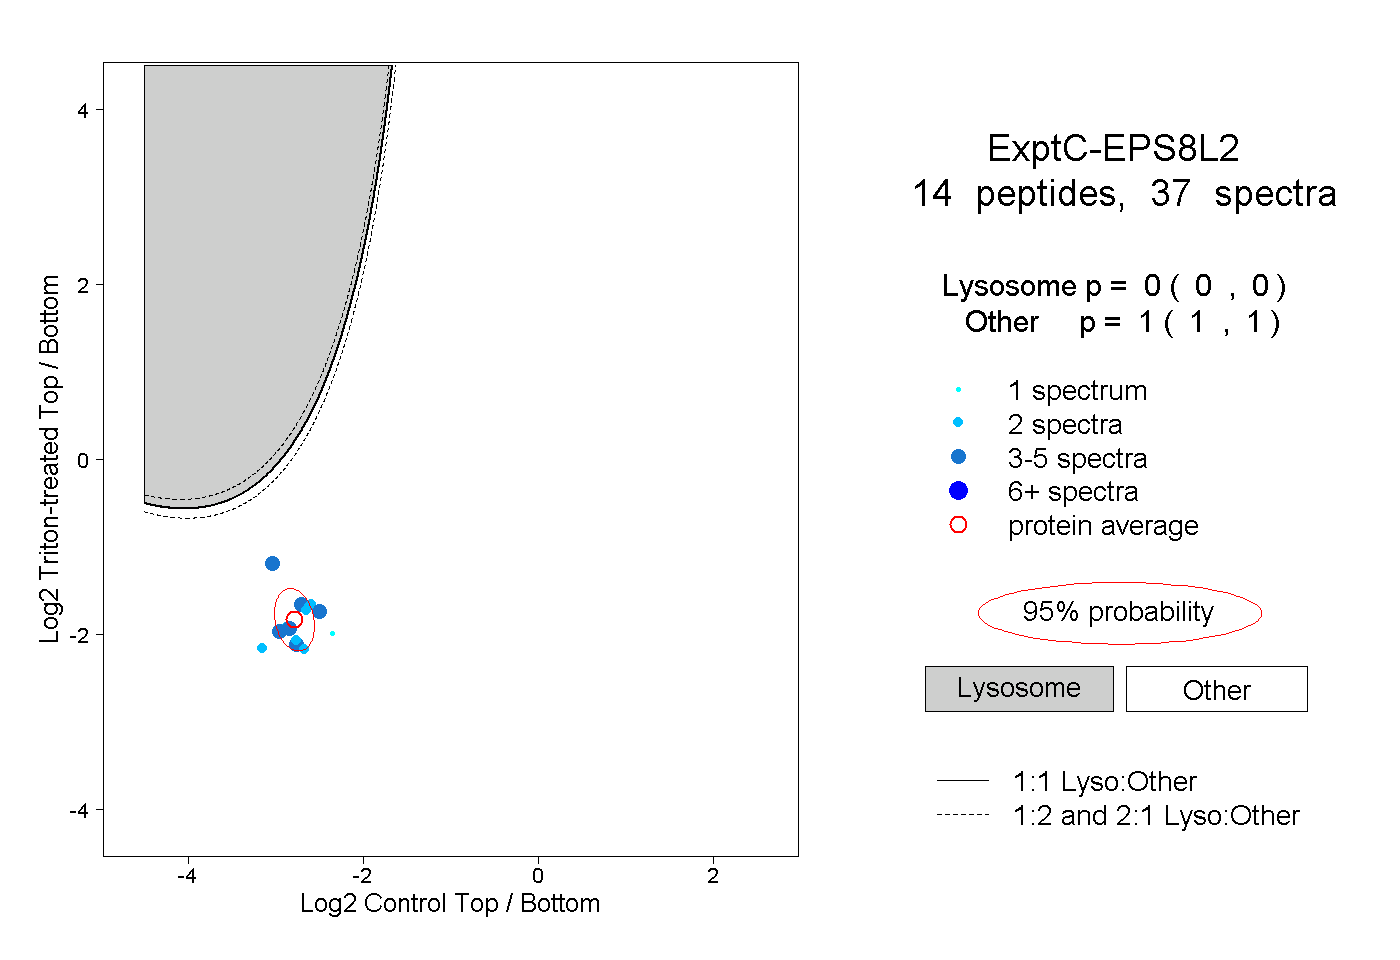
0.000 | 0.000
1.000 | 1.000
6peptides
spectra
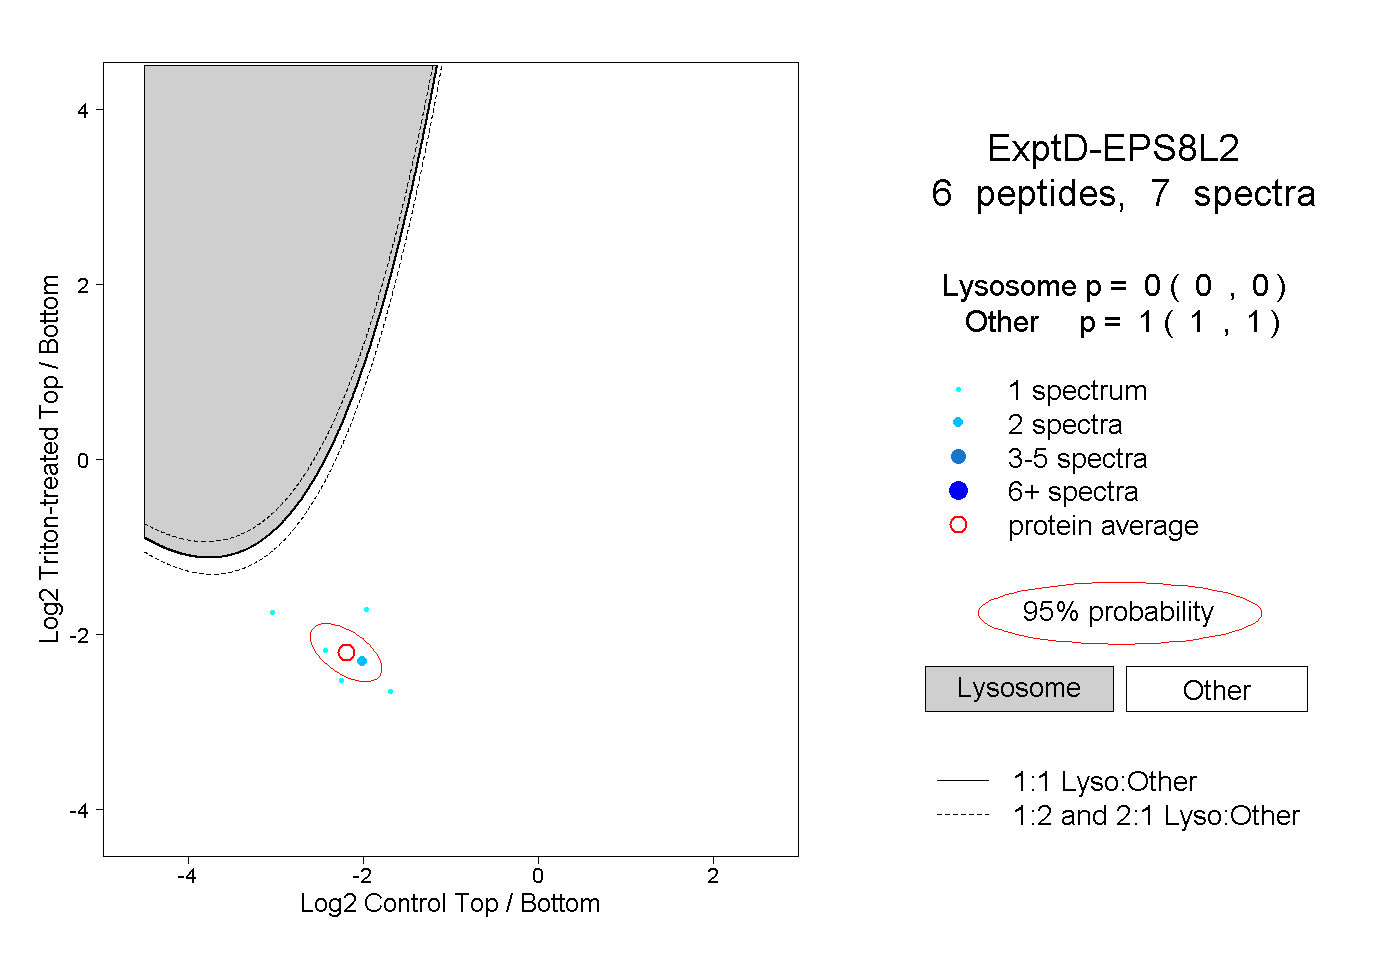
0.000 | 0.000
1.000 | 1.000