EPS8L2
[ENSRNOP00000024725]
Main page
| | | Plot |
Mito |
Lyso |
|
Perox |
ER |
Golgi |
PM |
Cytosol |
Nucleus |
|
| Expt A |
 17
17
peptides |
29
spectra |
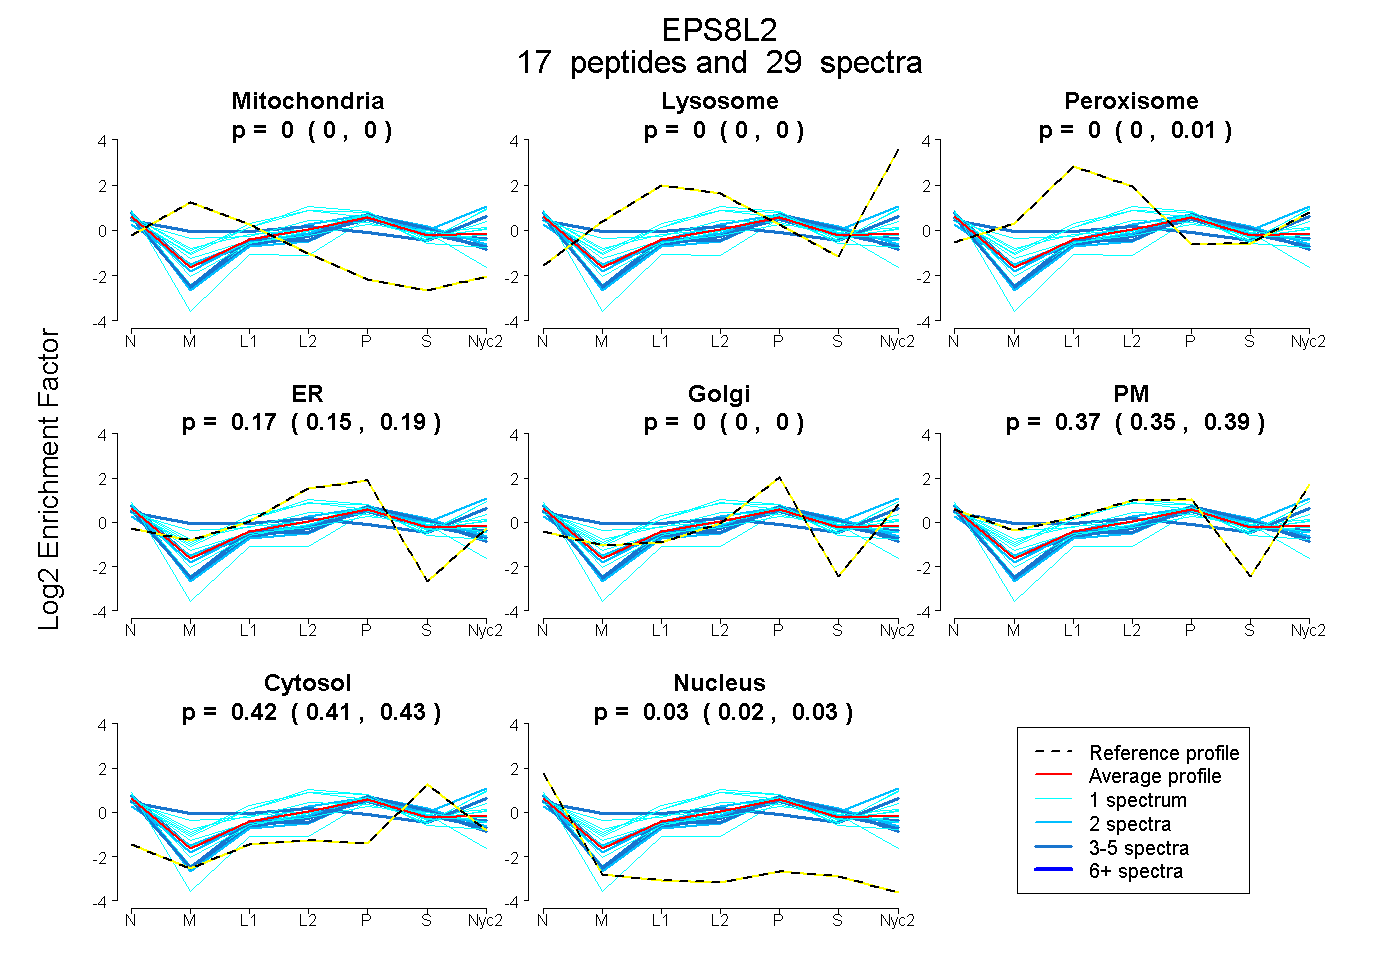 |
0.000
0.000 | 0.000 |
0.000
0.000 | 0.000 |
|
0.000
0.000 | 0.009 |
0.173
0.151 | 0.190 |
0.000
0.000 | 0.000 |
0.375
0.347 | 0.394 |
0.424
0.415 | 0.428 |
0.029
0.024 | 0.034 |
|
| | | Plot |
Mito |
|
Lyso or Perox |
|
ER |
Golgi |
PM |
Cytosol |
Nucleus |
|
| Expt B |
5
peptides |
7
spectra |
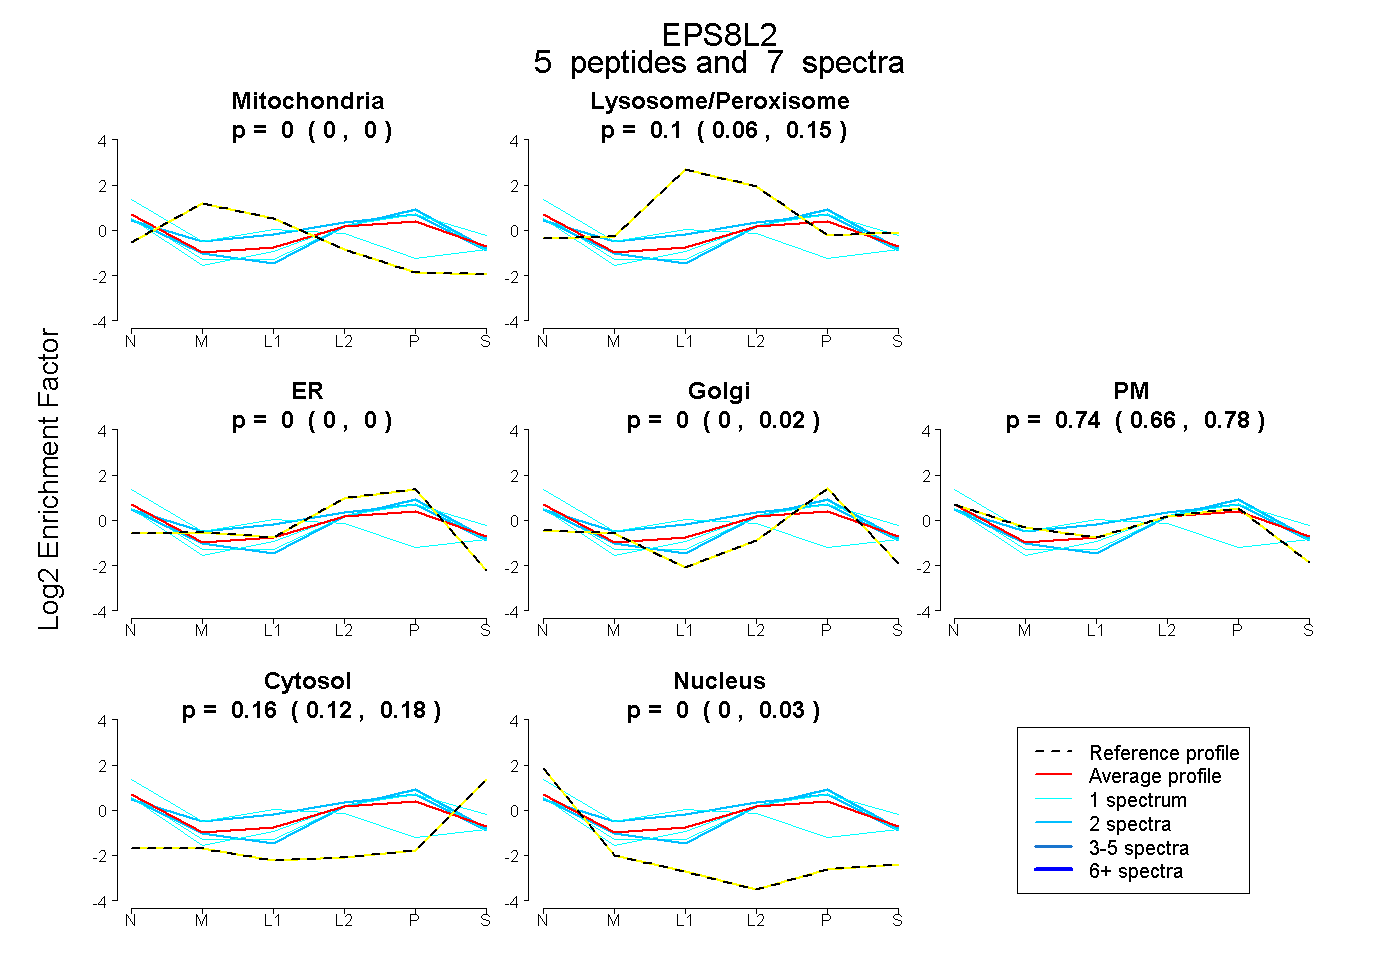 |
0.000
0.000 | 0.000 |
|
0.101
0.061 | 0.146 |
|
0.000
0.000 | 0.000 |
0.000
0.000 | 0.018 |
0.743
0.655 | 0.779 |
0.157
0.123 | 0.178 |
0.000
0.000 | 0.027 |
|
| 1 spectrum, LAINLLAK |
0.000 |
|
0.126 |
|
0.061 |
0.048 |
0.541 |
0.225 |
0.000 |
|
| 2 spectra, ILYDFTAR |
0.000 |
|
0.000 |
|
0.134 |
0.121 |
0.598 |
0.147 |
0.000 |
|
| 1 spectrum, AVLAQR |
0.000 |
|
0.000 |
|
0.092 |
0.058 |
0.708 |
0.142 |
0.000 |
|
| 2 spectra, AAEAFK |
0.000 |
|
0.259 |
|
0.000 |
0.155 |
0.545 |
0.042 |
0.000 |
|
| 1 spectrum, SEAIATVDDAIR |
0.000 |
|
0.481 |
|
0.000 |
0.000 |
0.138 |
0.000 |
0.381 |
|
| | | Plot |
|
Lyso |
|
|
|
|
|
|
|
Other |
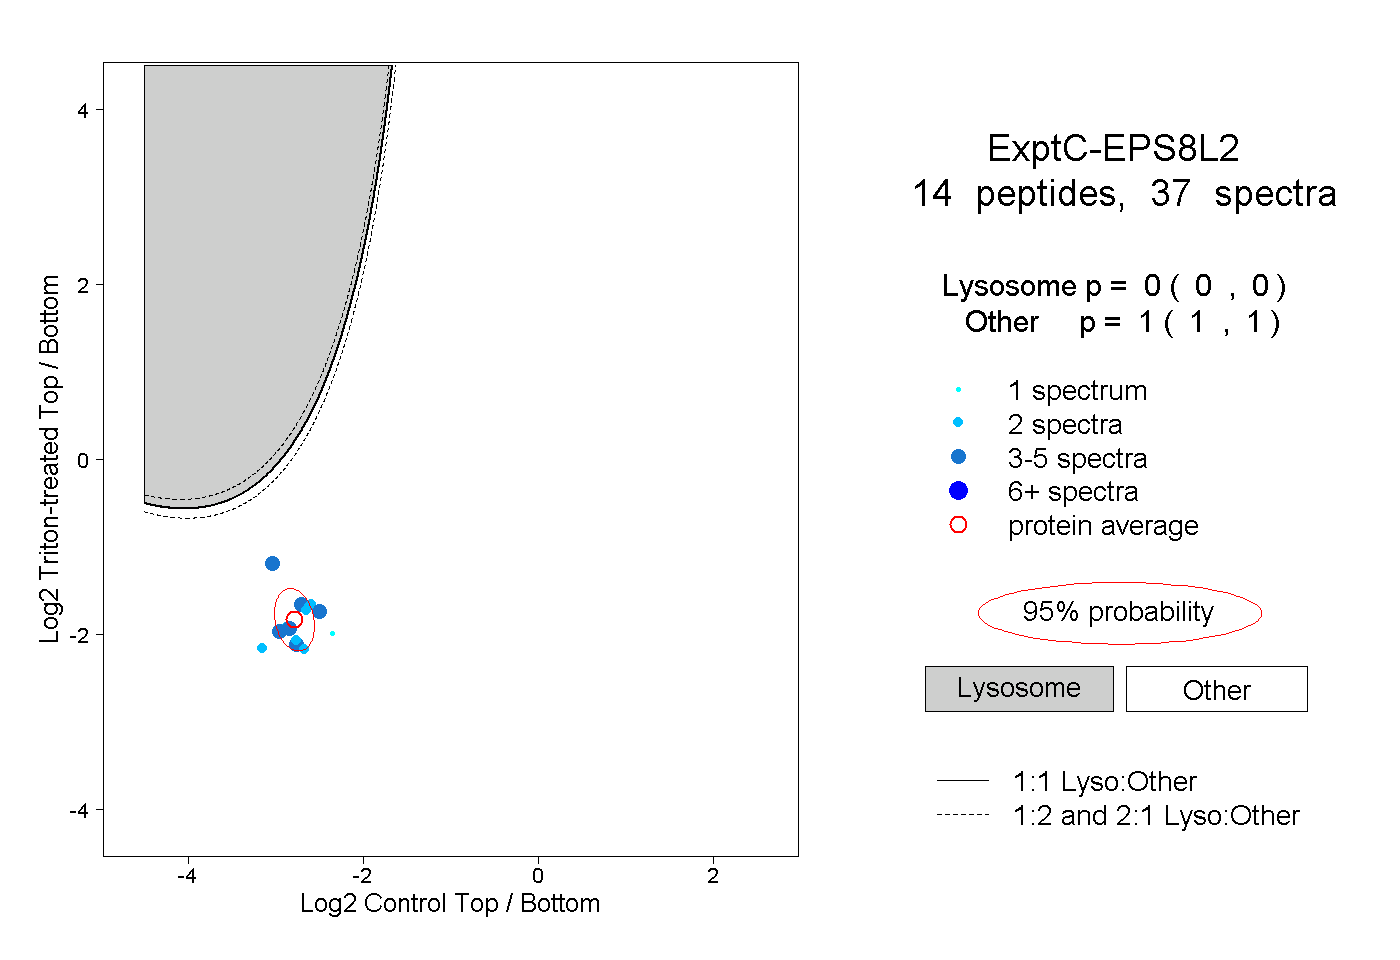
| Expt C |
14
peptides |
37
spectra |
 |
|
0.000
0.000 | 0.000 |
|
|
|
|
|
|
|
1.000
1.000 | 1.000 |
| | | Plot |
|
Lyso |
|
|
|
|
|
|
|
Other |
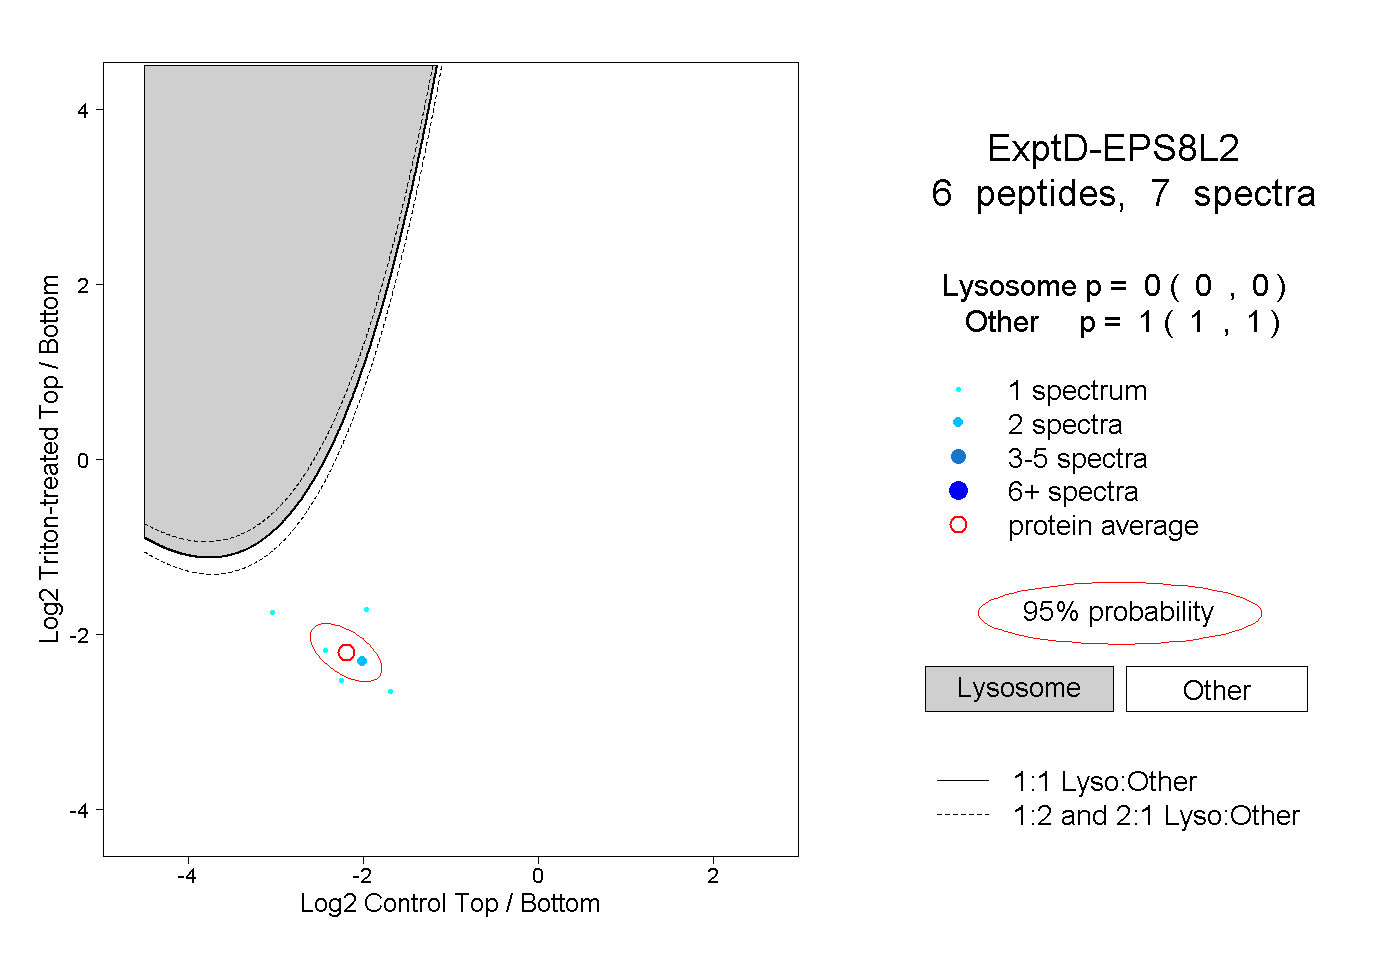
| Expt D |
6
peptides |
7
spectra |
 |
|
0.000
0.000 | 0.000 |
|
|
|
|
|
|
|
1.000
1.000 | 1.000 |