 7
7peptides
spectra
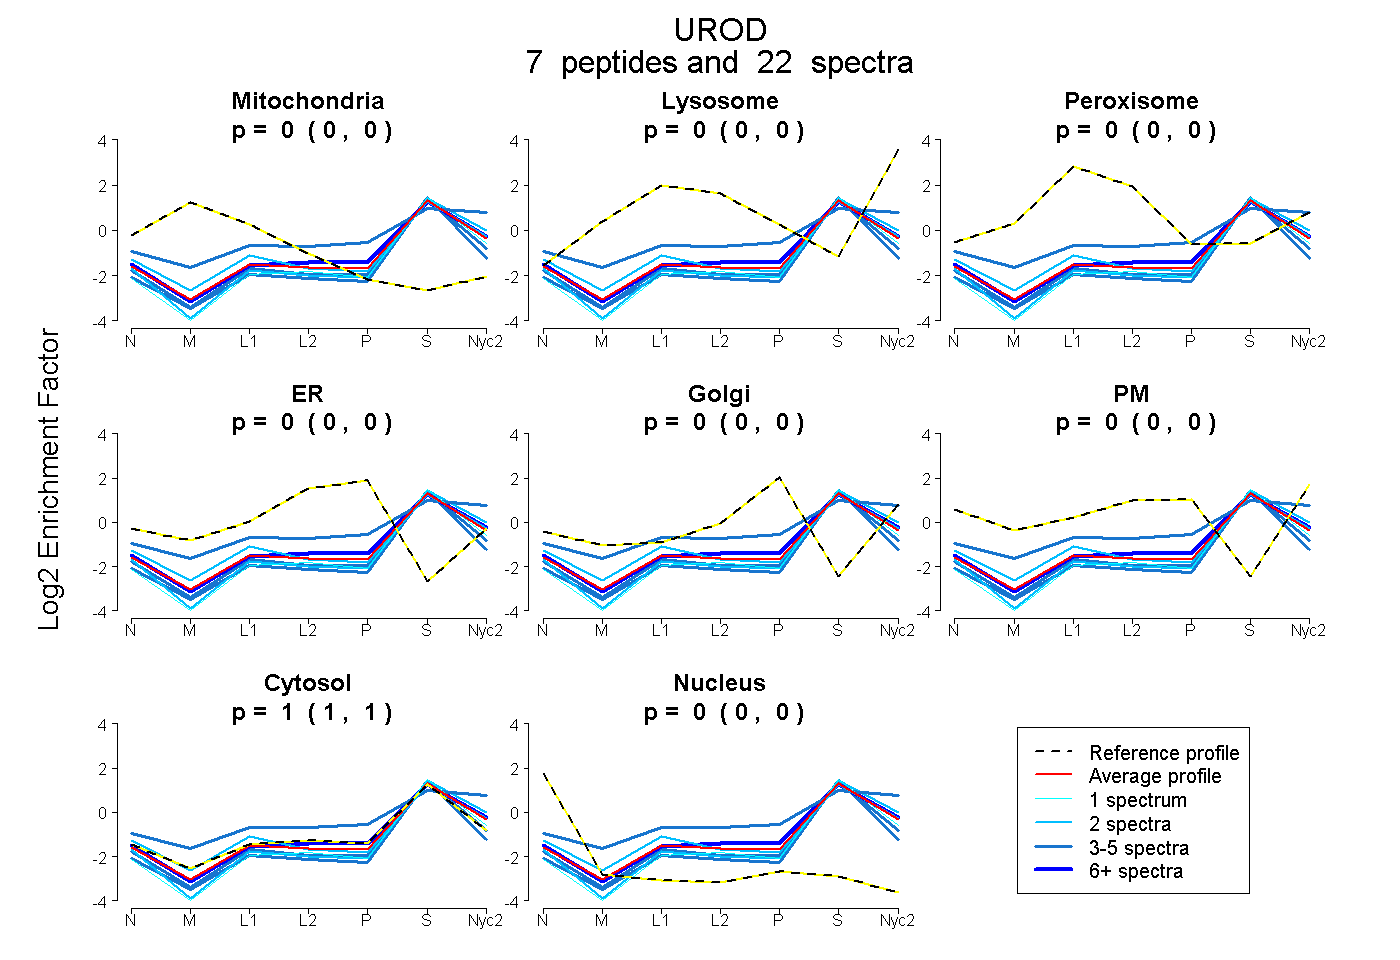
0.000 | 0.000
0.000 | 0.000
0.000 | 0.000
0.000 | 0.000
0.000 | 0.000
0.000 | 0.000
1.000 | 1.000
0.000 | 0.000
5peptides
spectra
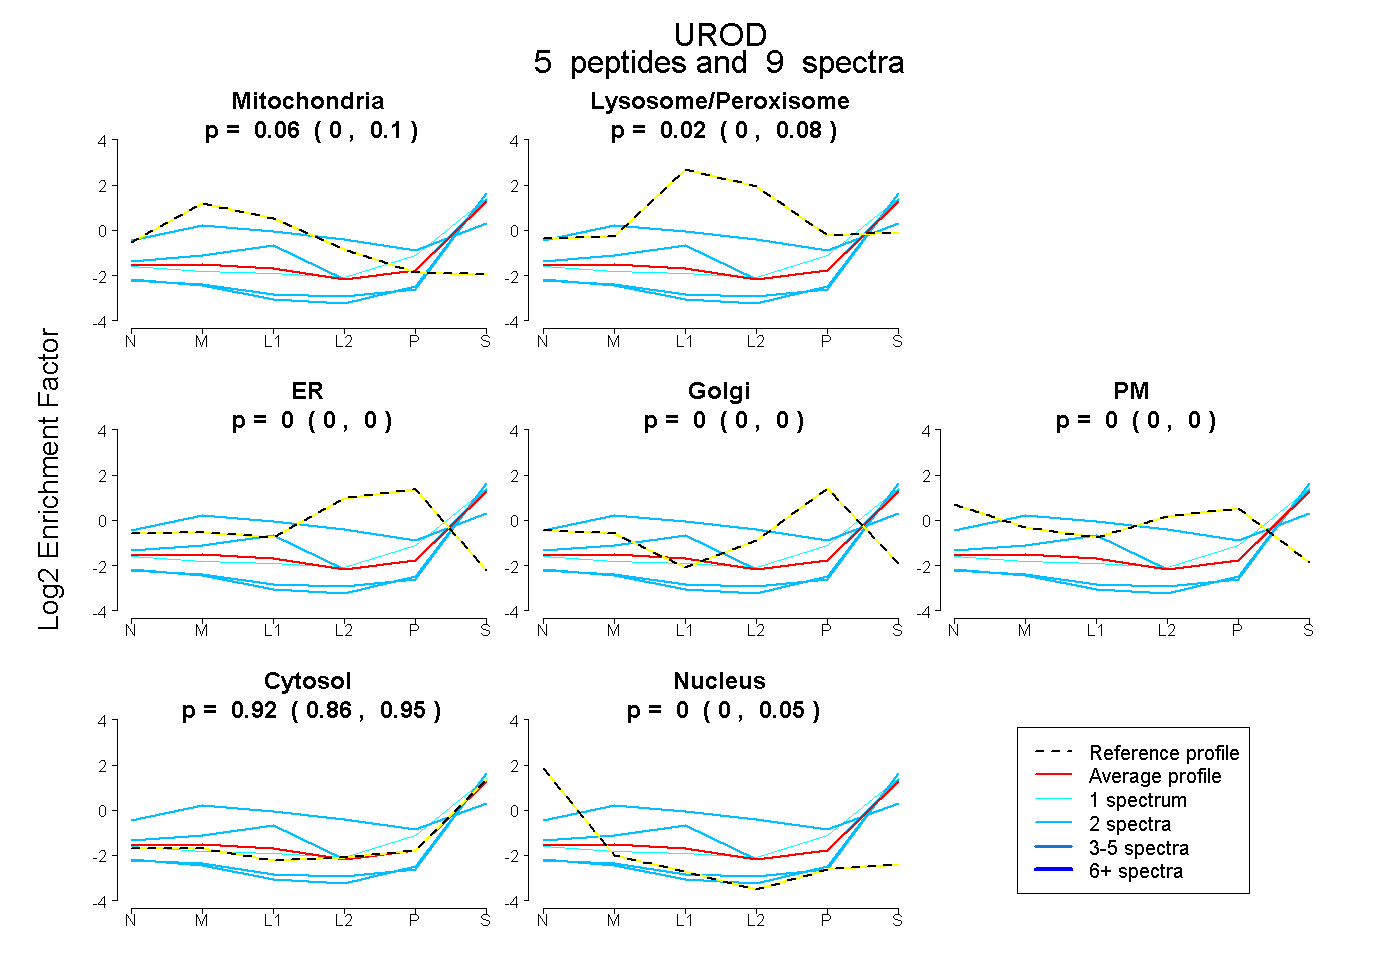
0.000 | 0.098
0.000 | 0.085
0.000 | 0.000
0.000 | 0.000
0.000 | 0.000
0.861 | 0.952
0.000 | 0.047
7peptides
spectra
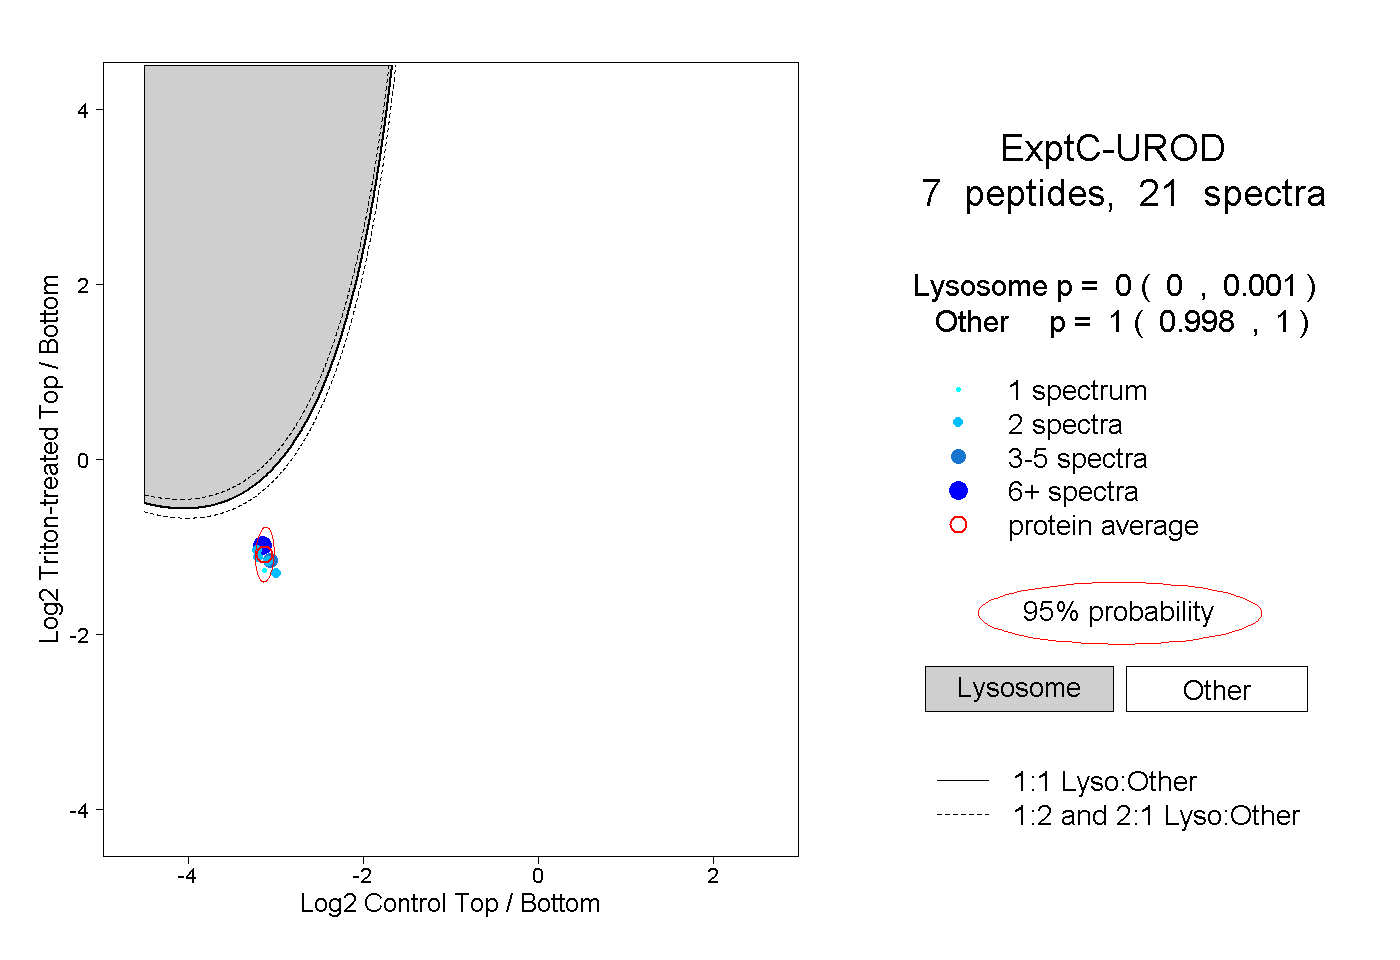
0.000 | 0.001
0.998 | 1.000
2peptides
spectra
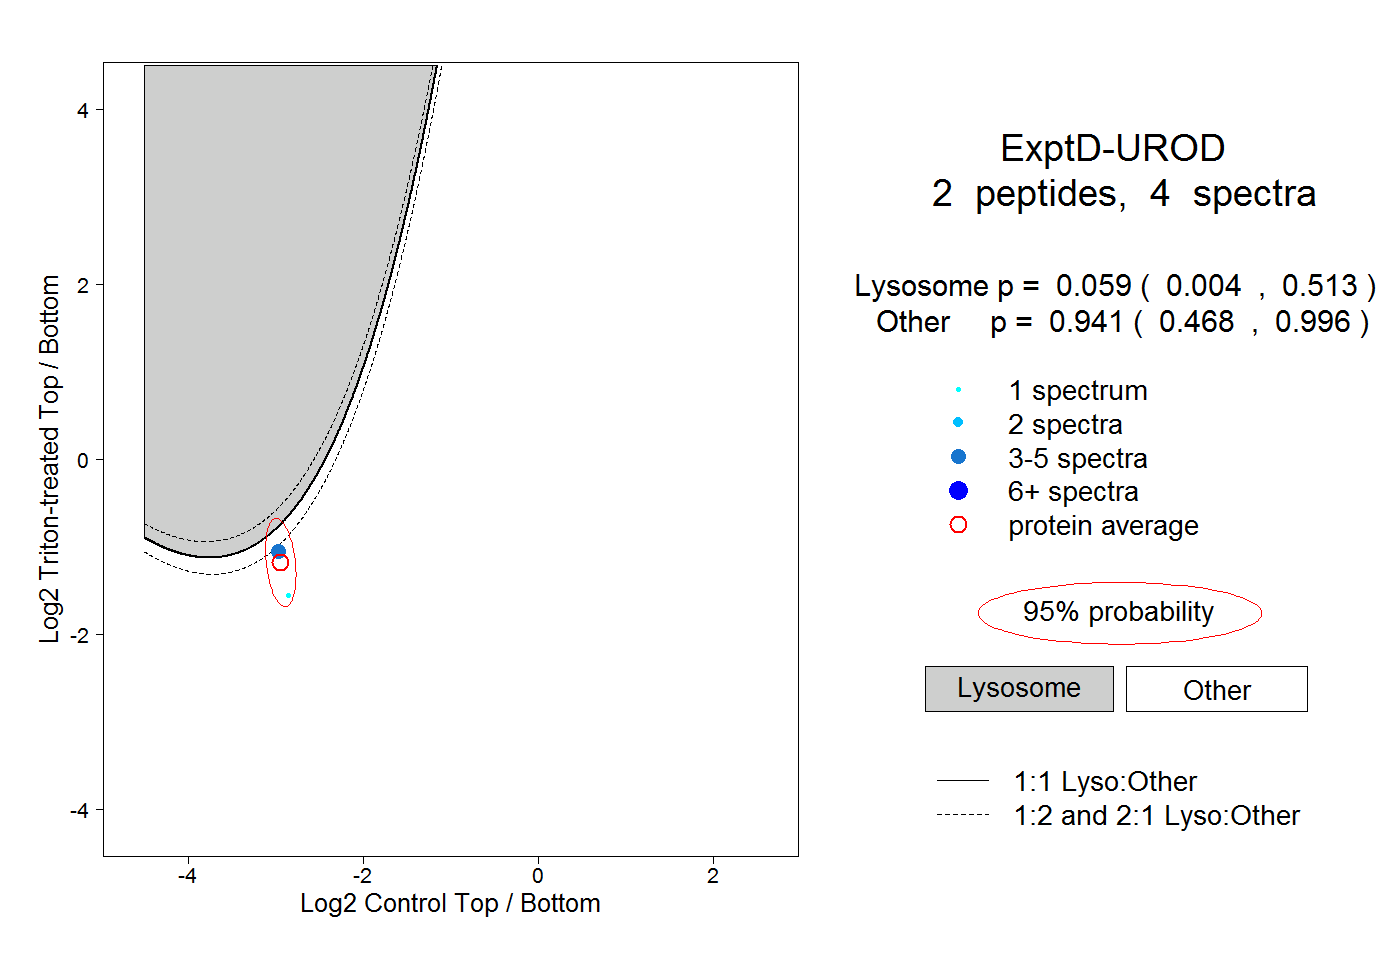
0.004 | 0.513
0.468 | 0.996