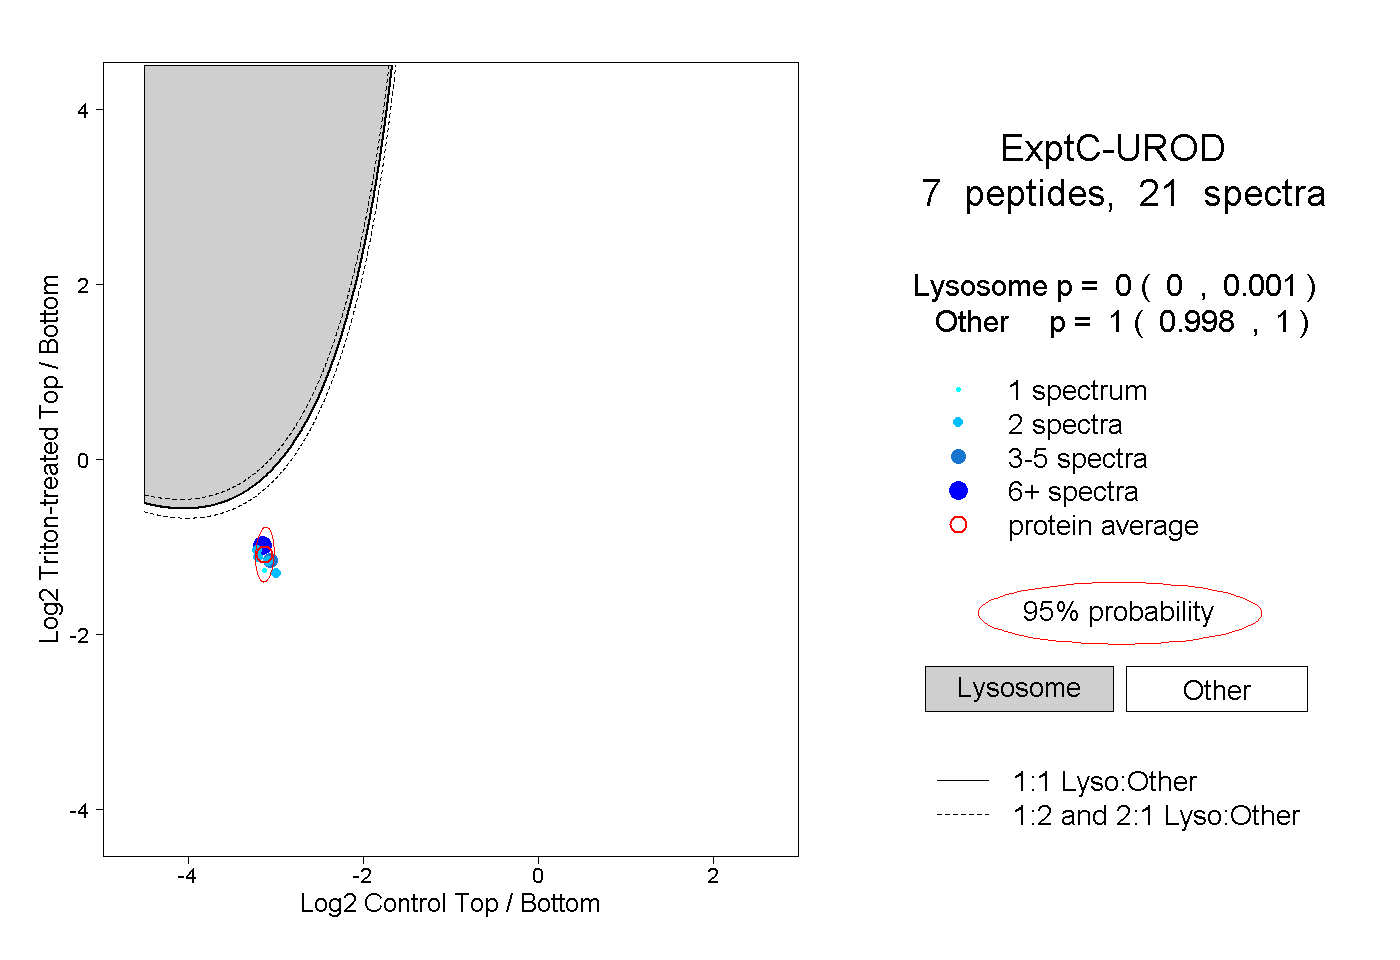
7
7peptides
spectra
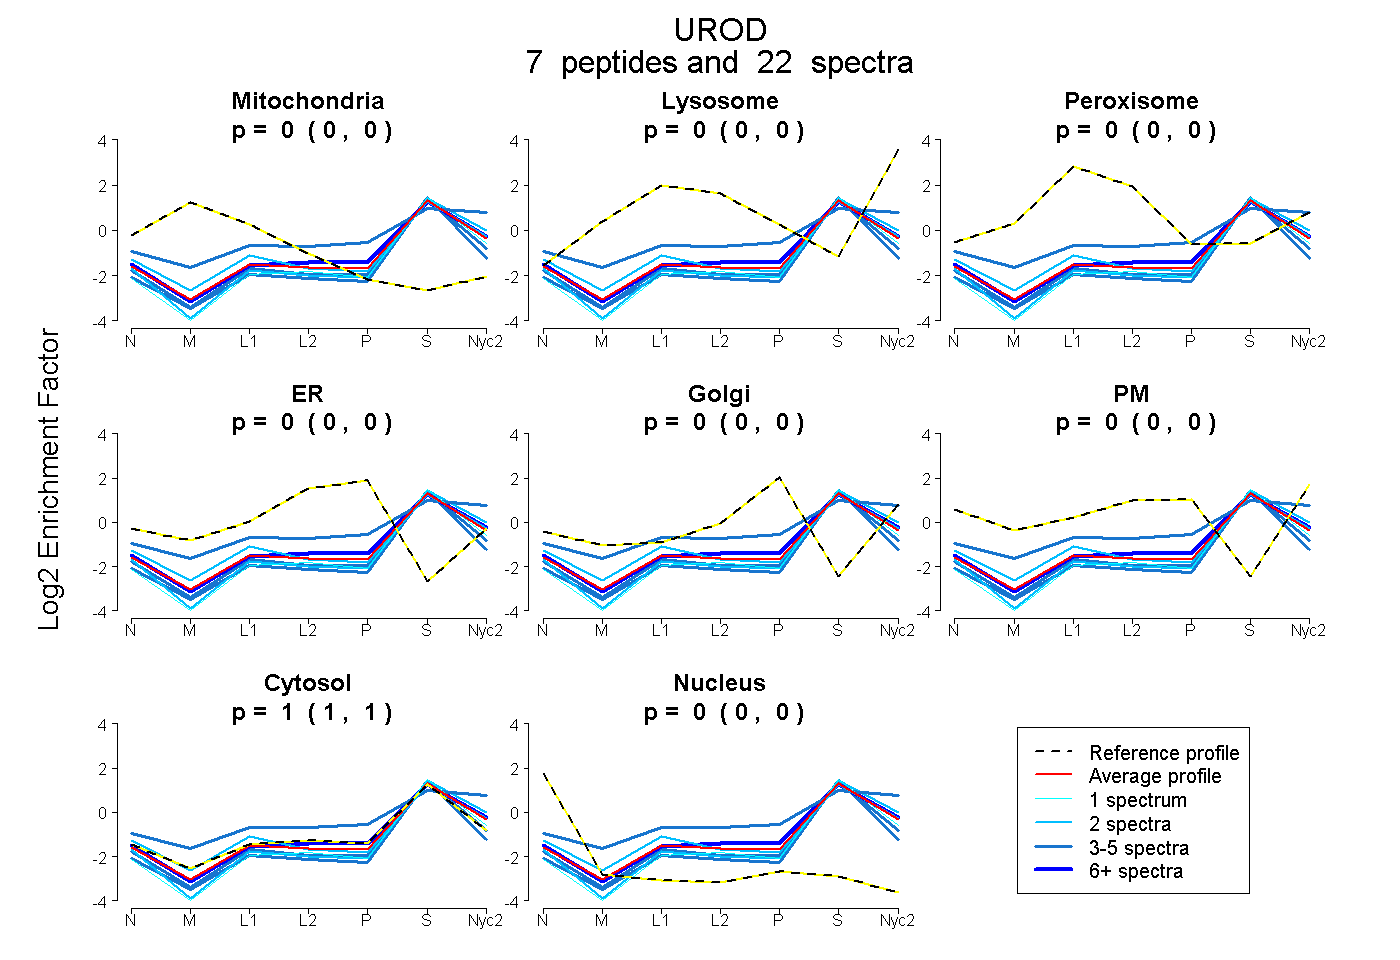
0.000 | 0.000
0.000 | 0.000
0.000 | 0.000
0.000 | 0.000
0.000 | 0.000
0.000 | 0.000
1.000 | 1.000
0.000 | 0.000
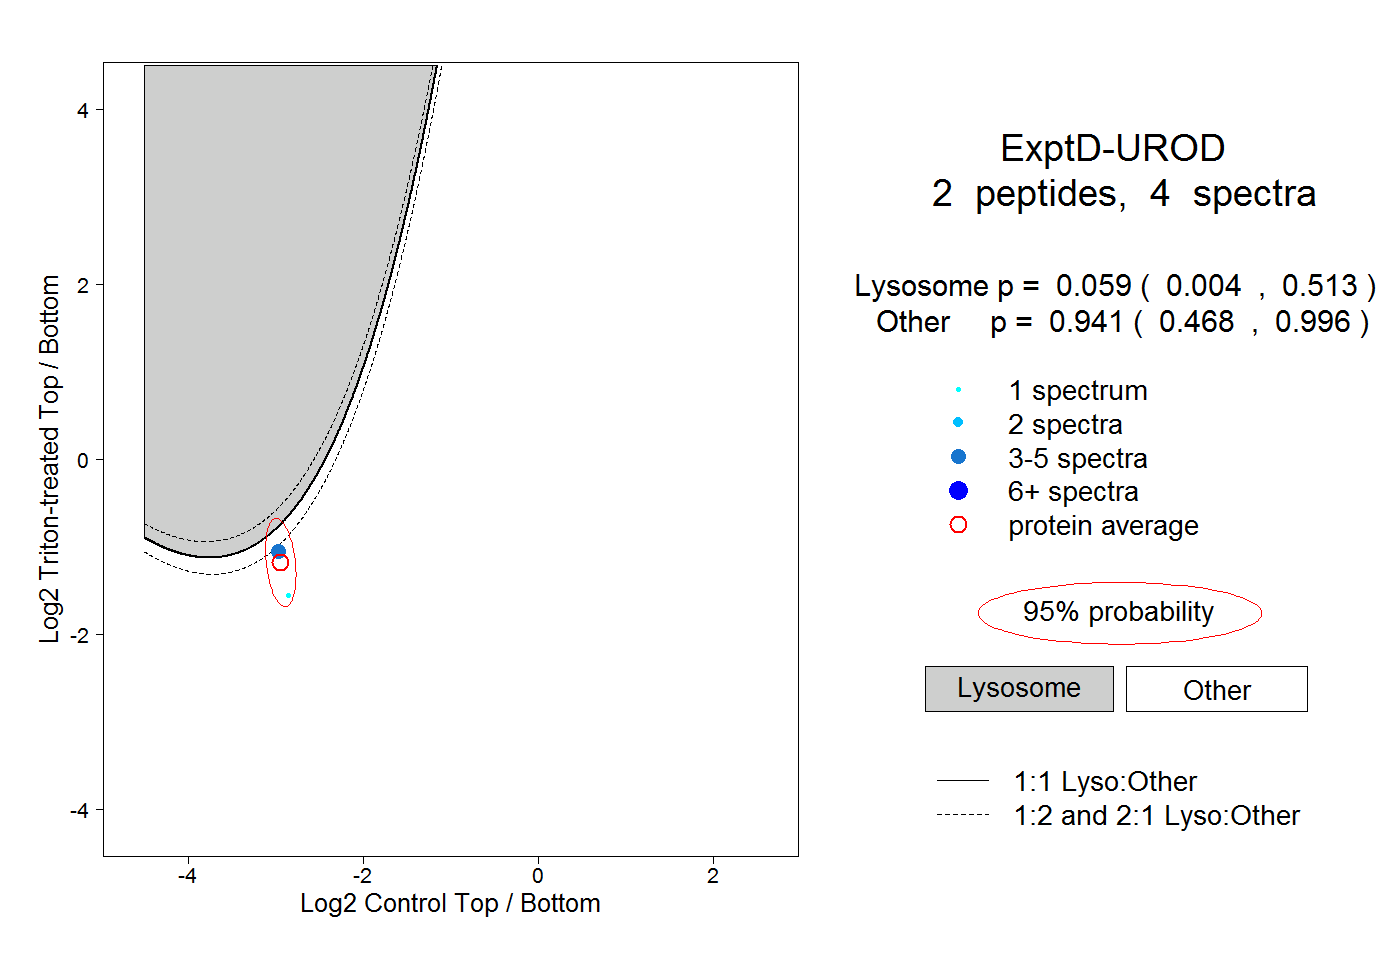
5peptides
spectra
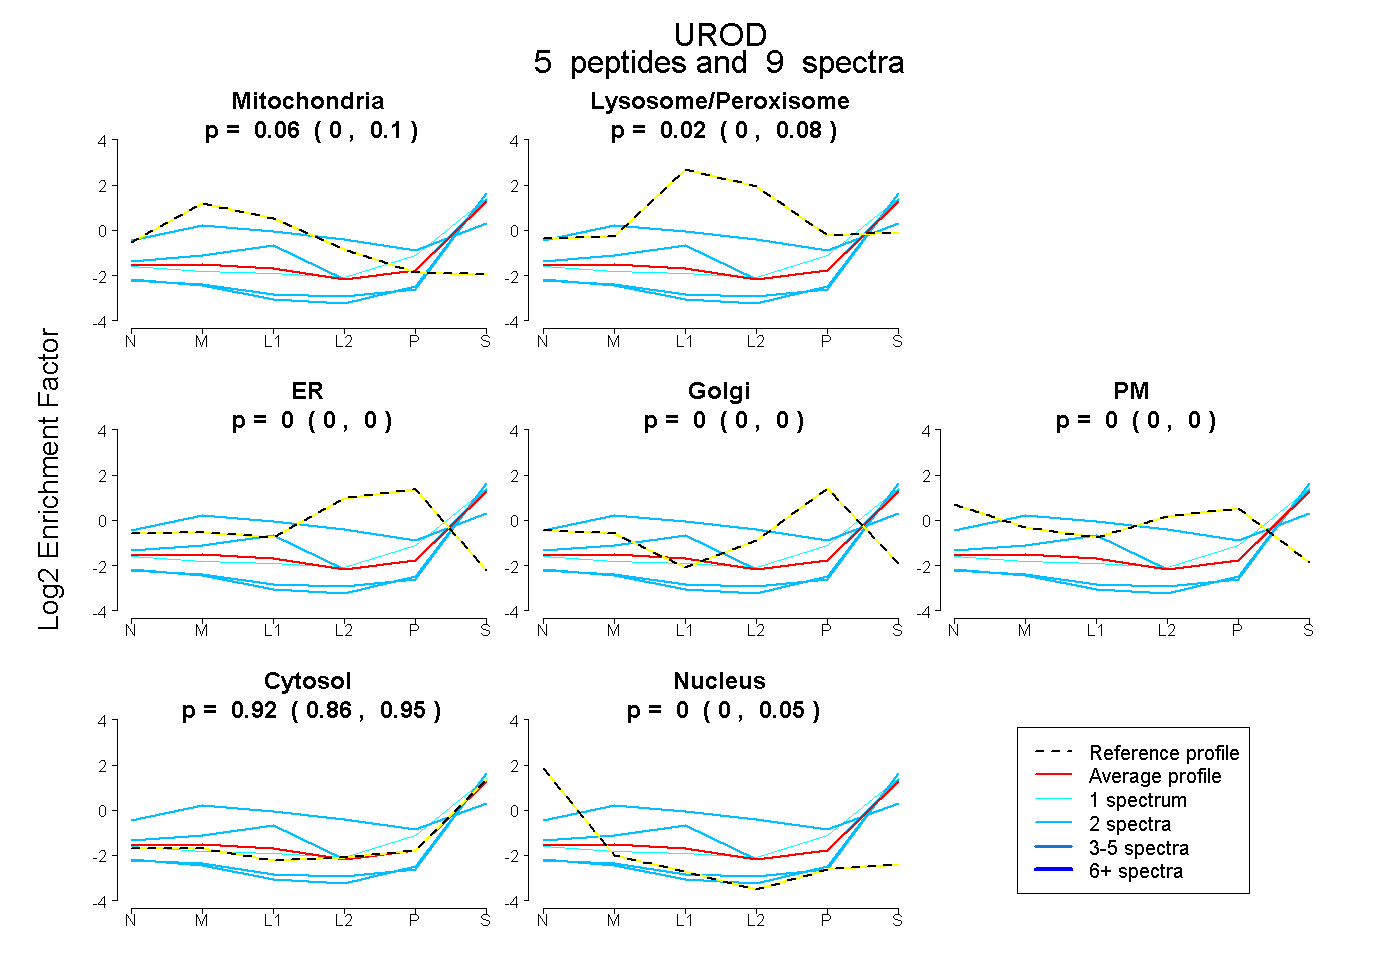
0.000 | 0.098
0.000 | 0.085
0.000 | 0.000
0.000 | 0.000
0.000 | 0.000
0.861 | 0.952
0.000 | 0.047