 5
5peptides
spectra
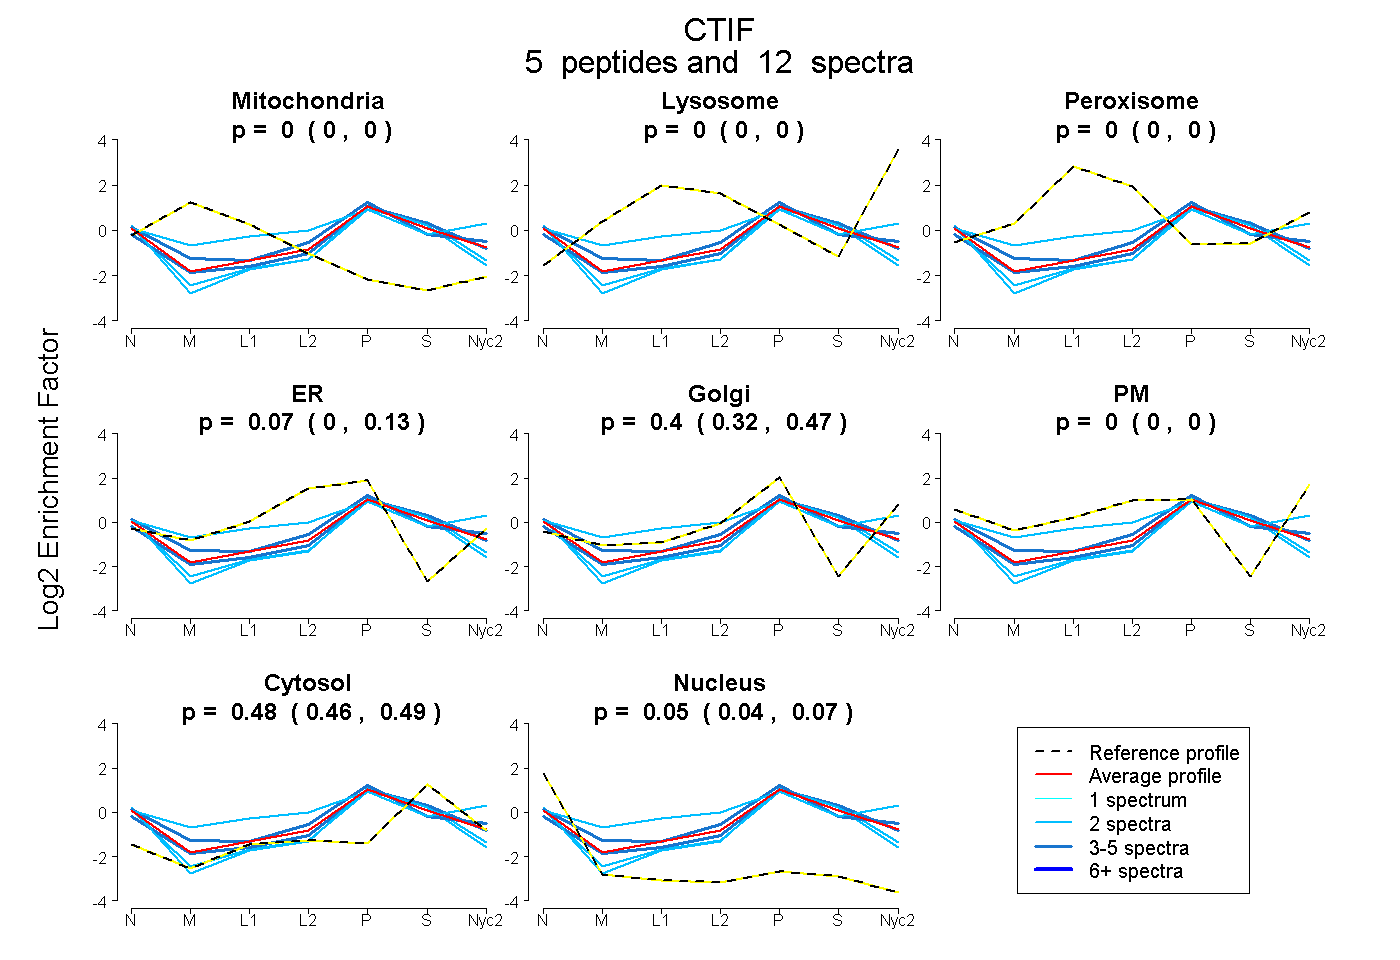
0.000 | 0.000
0.000 | 0.000
0.000 | 0.000
0.000 | 0.127
0.324 | 0.467
0.000 | 0.000
0.461 | 0.490
0.036 | 0.068
3peptides
spectra
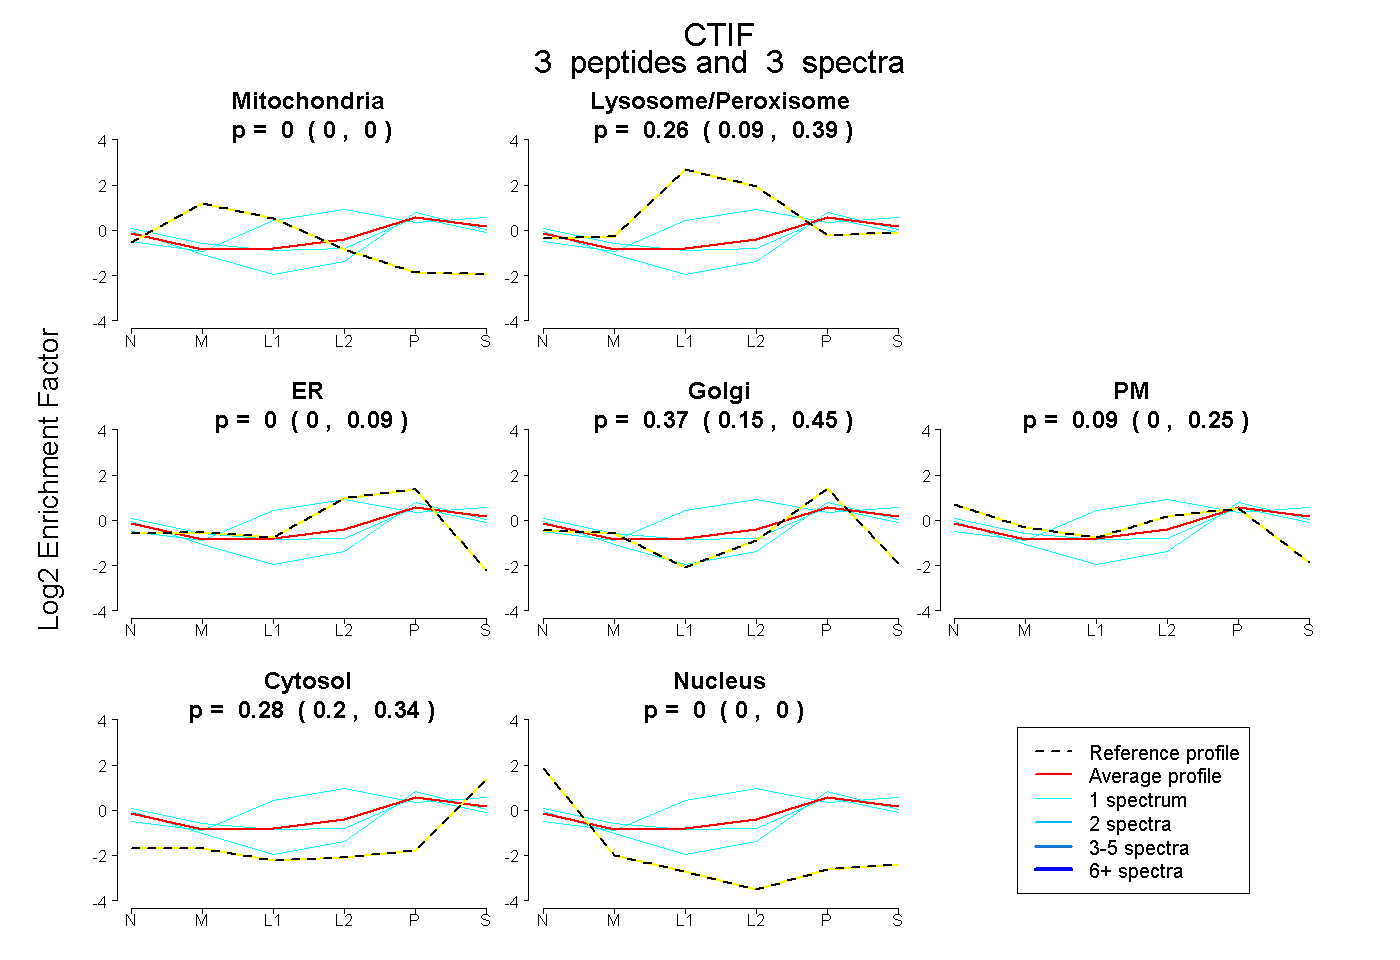
0.000 | 0.000
0.092 | 0.391
0.000 | 0.087
0.147 | 0.447
0.000 | 0.245
0.197 | 0.339
0.000 | 0.002
5peptides
spectra
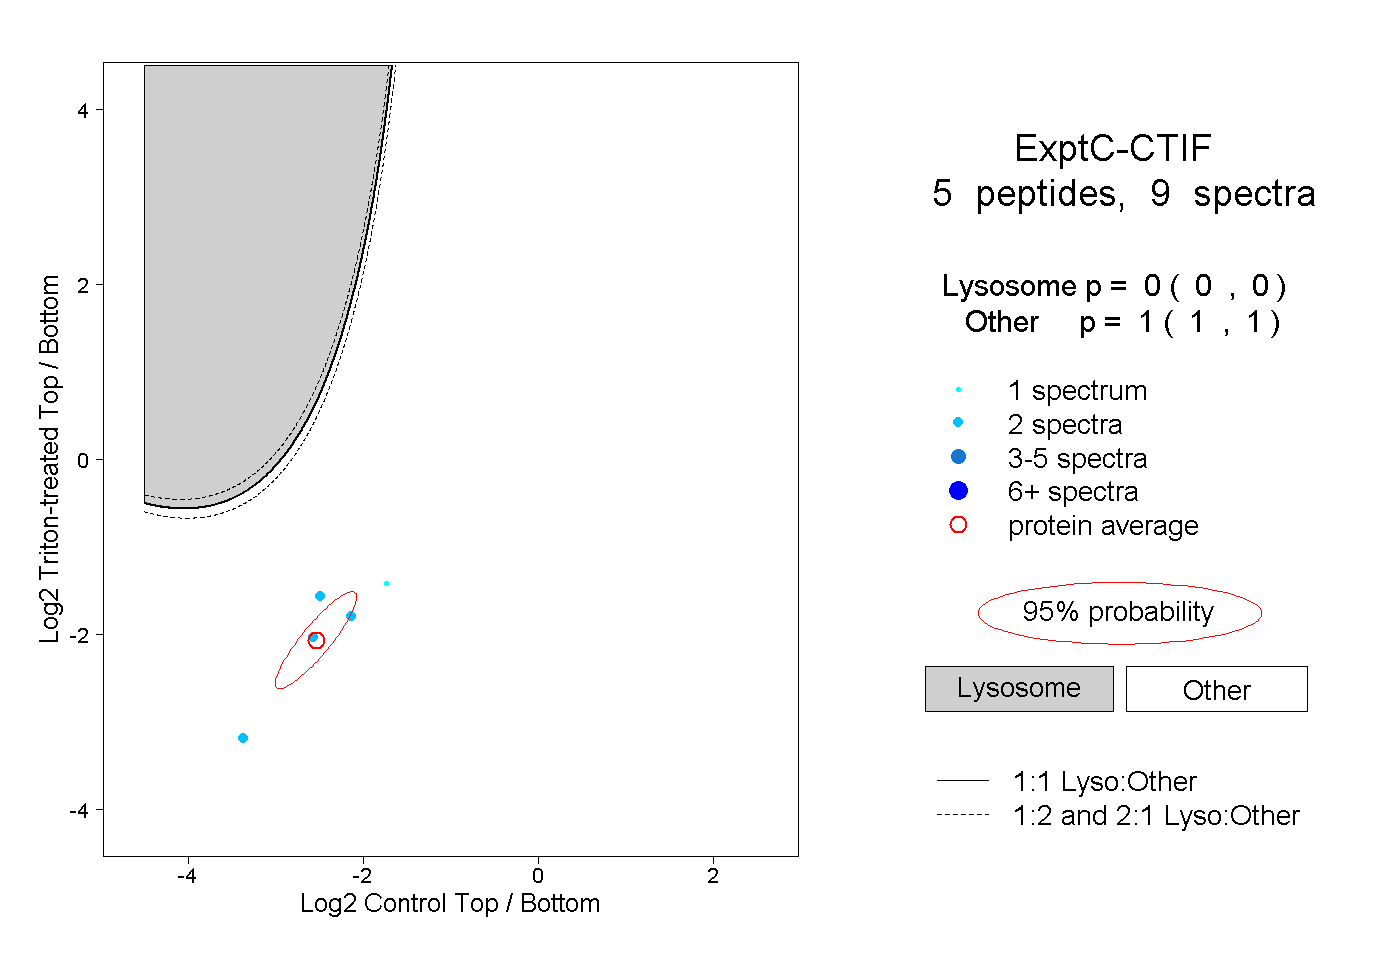
0.000 | 0.000
1.000 | 1.000
1peptide
spectrum
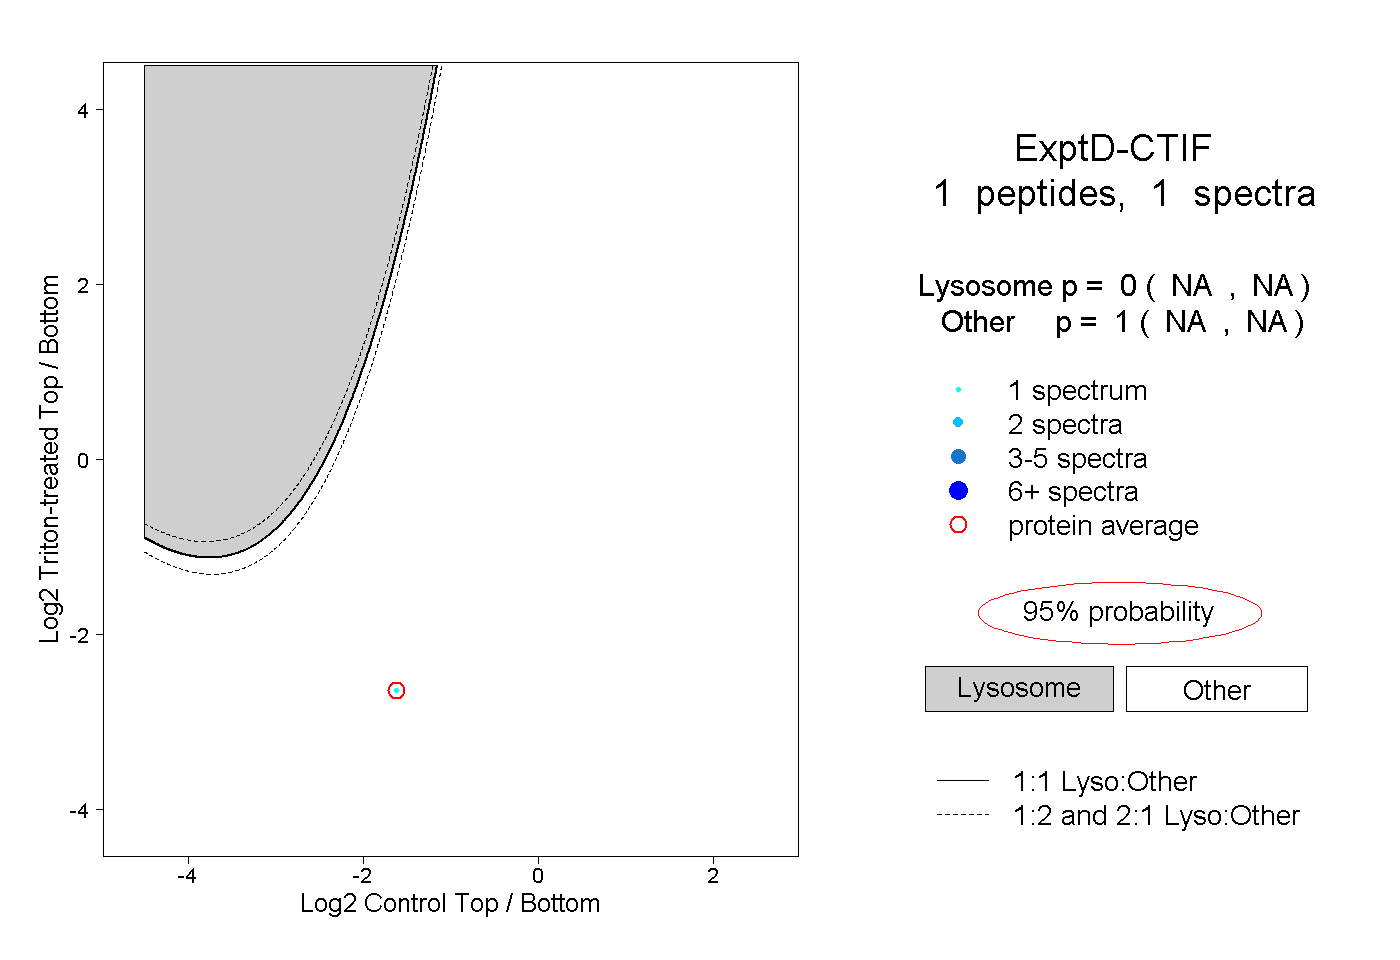
NA | NA
NA | NA