 5
5peptides
spectra
0.000 | 0.000
0.000 | 0.000
0.000 | 0.000
0.000 | 0.127
0.324 | 0.467
0.000 | 0.000
0.461 | 0.490
0.036 | 0.068
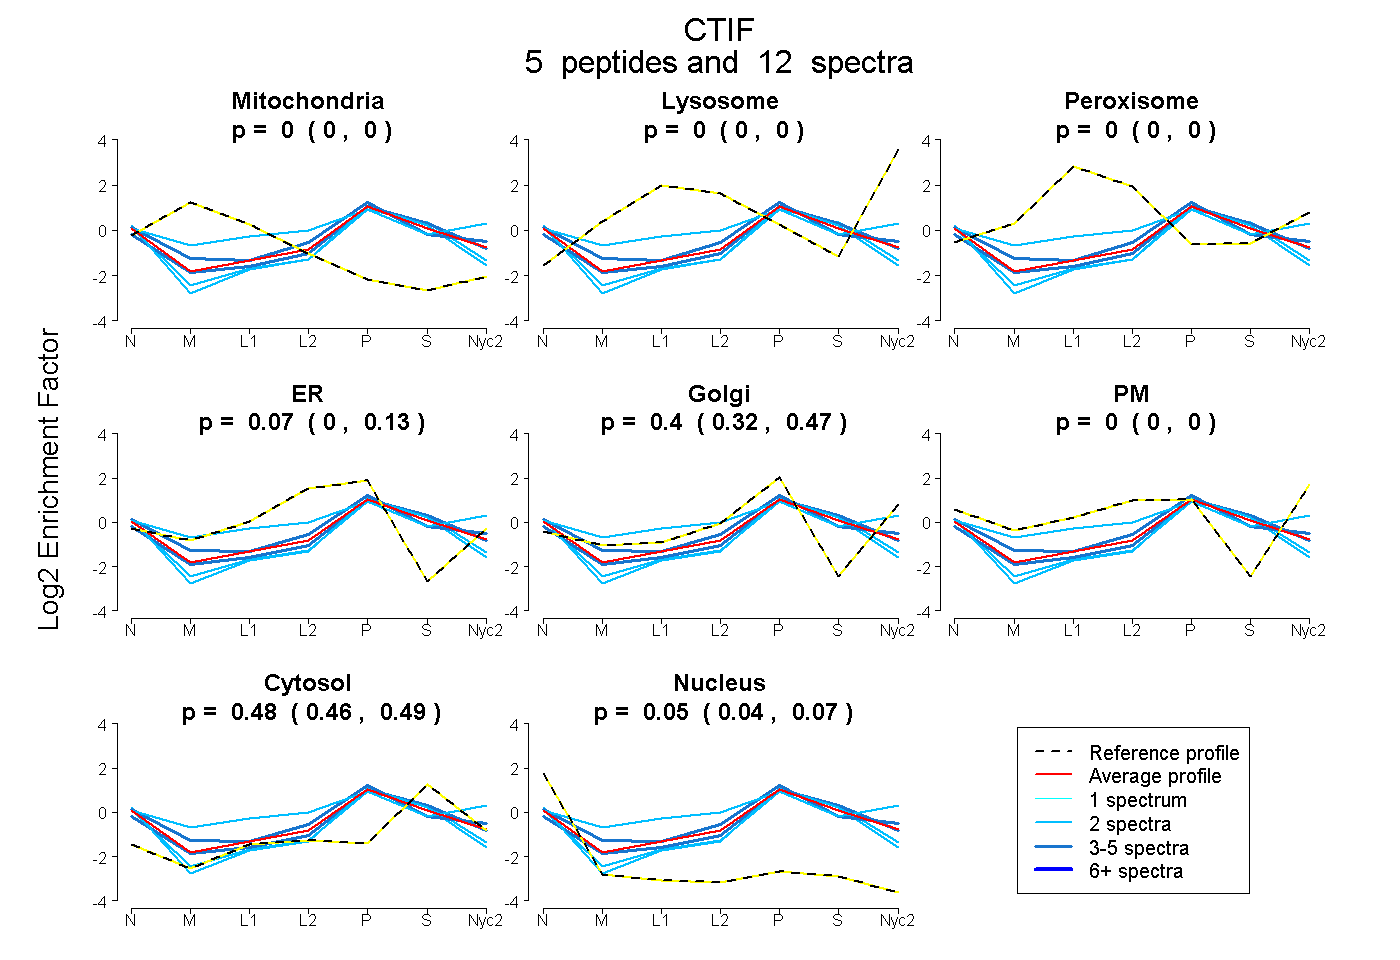
| Plot | Mito | Lyso | Perox | ER | Golgi | PM | Cytosol | Nucleus | |||||
| Expt A |
5 peptides |
12 spectra |
|
0.000 0.000 | 0.000 |
0.000 0.000 | 0.000 |
0.000 0.000 | 0.000 |
0.067 0.000 | 0.127 |
0.402 0.324 | 0.467 |
0.000 0.000 | 0.000 |
0.477 0.461 | 0.490 |
0.053 0.036 | 0.068 |
| 2 spectra, SLLLNMLQK | 0.000 | 0.000 | 0.168 | 0.000 | 0.328 | 0.194 | 0.310 | 0.000 | ||
| 2 spectra, LGERPK | 0.000 | 0.000 | 0.000 | 0.004 | 0.333 | 0.000 | 0.501 | 0.161 | ||
| 2 spectra, EELQQQDVER | 0.000 | 0.000 | 0.000 | 0.000 | 0.343 | 0.000 | 0.524 | 0.132 | ||
| 3 spectra, LTEILNSMR | 0.000 | 0.000 | 0.000 | 0.104 | 0.469 | 0.000 | 0.395 | 0.032 | ||
| 3 spectra, ITLLQSSK | 0.000 | 0.000 | 0.000 | 0.000 | 0.424 | 0.000 | 0.533 | 0.042 |
| Plot | Mito | Lyso or Perox | ER | Golgi | PM | Cytosol | Nucleus | ||||||
| Expt B |
3 peptides |
3 spectra |
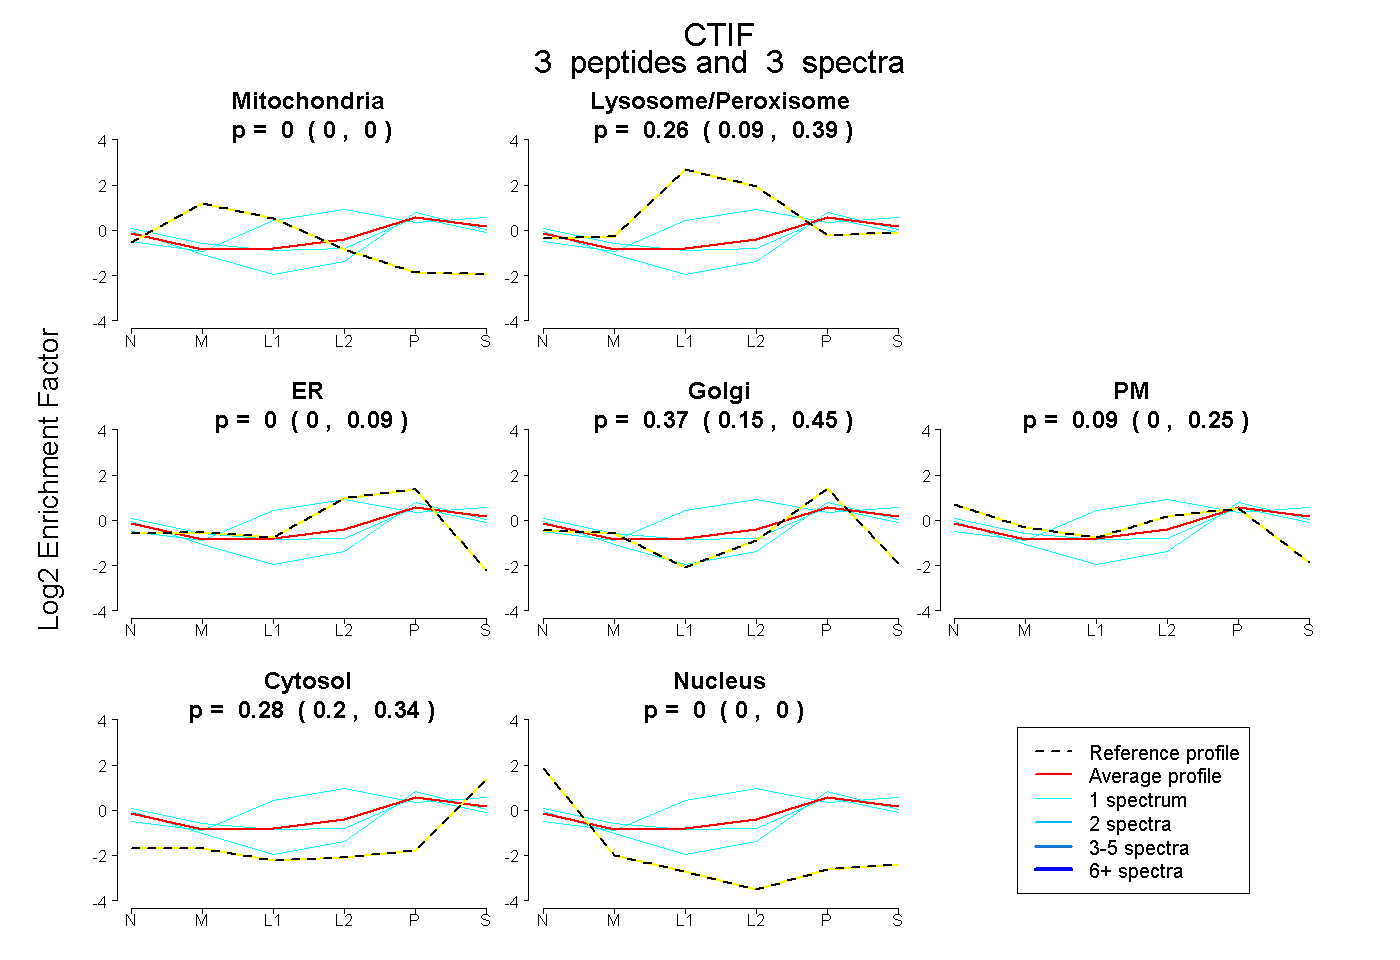 |
0.000 0.000 | 0.000 |
0.265 0.092 | 0.391 |
0.000 0.000 | 0.087 |
0.370 0.147 | 0.447 |
0.090 0.000 | 0.245 |
0.275 0.197 | 0.339 |
0.000 0.000 | 0.002 |
|||
| Plot | Lyso | Other | |||||||||||
| Expt C |
5 peptides |
9 spectra |
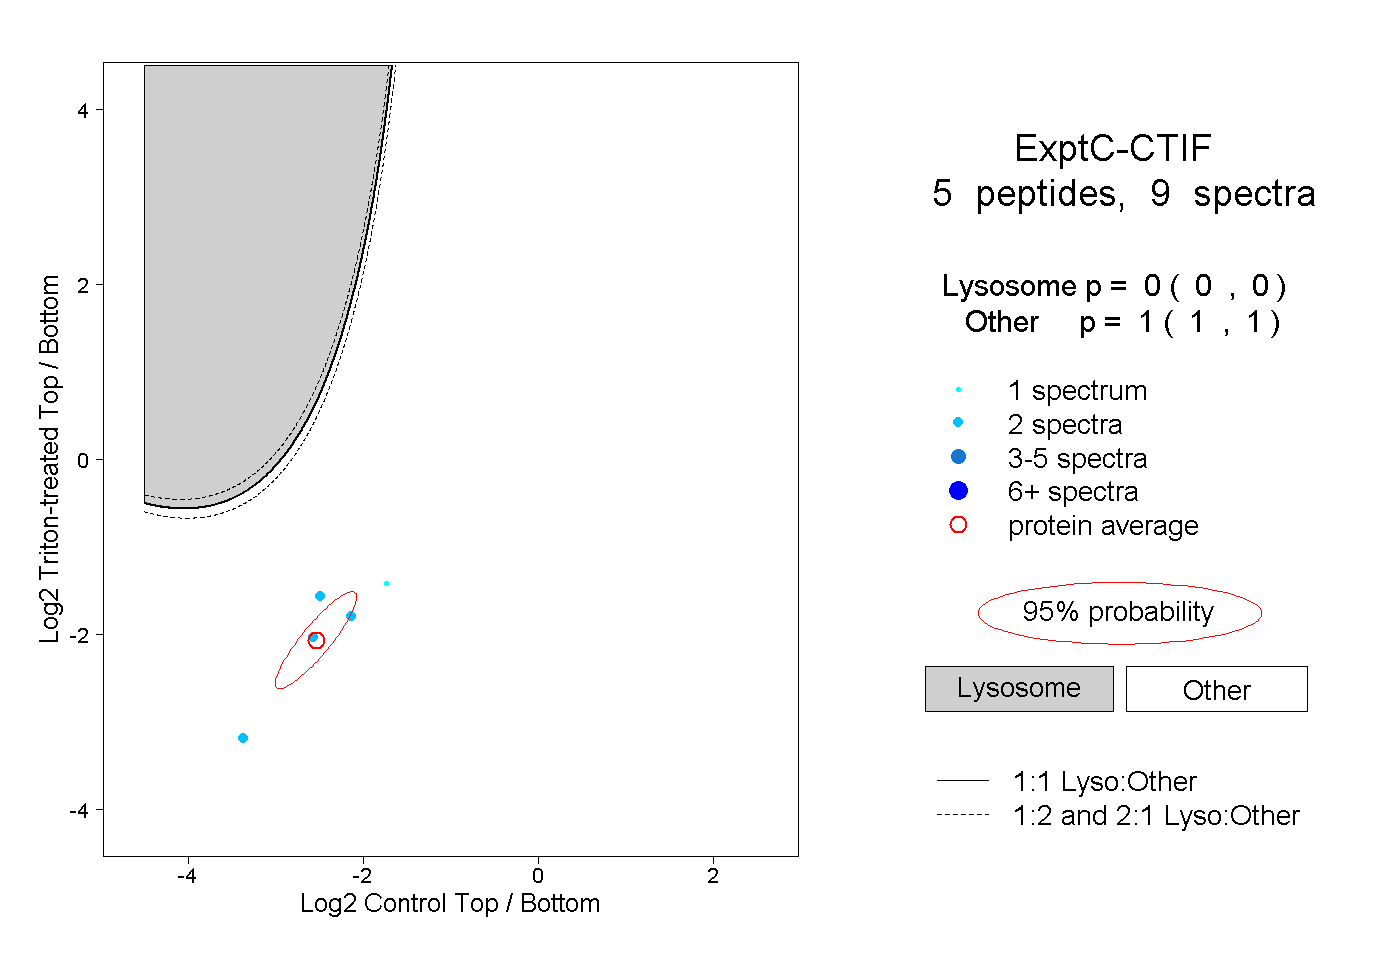 |
0.000 0.000 | 0.000 |
1.000 1.000 | 1.000 |
||||||||
| Plot | Lyso | Other | |||||||||||
| Expt D |
1 peptide |
1 spectrum |
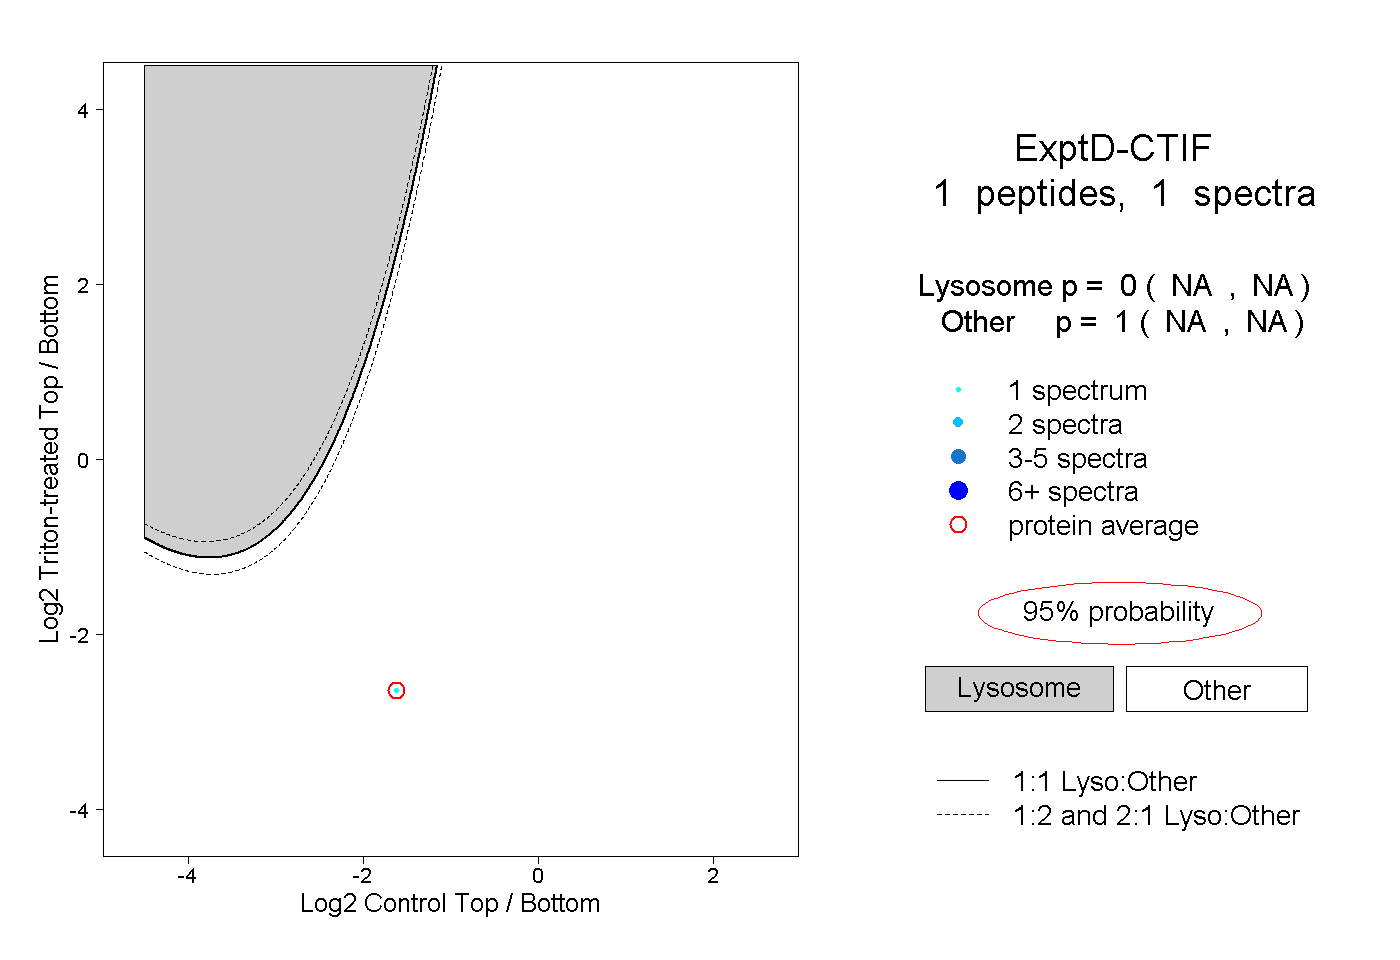 |
0.000 NA | NA |
1.000 NA | NA |