 7
7peptides
spectra
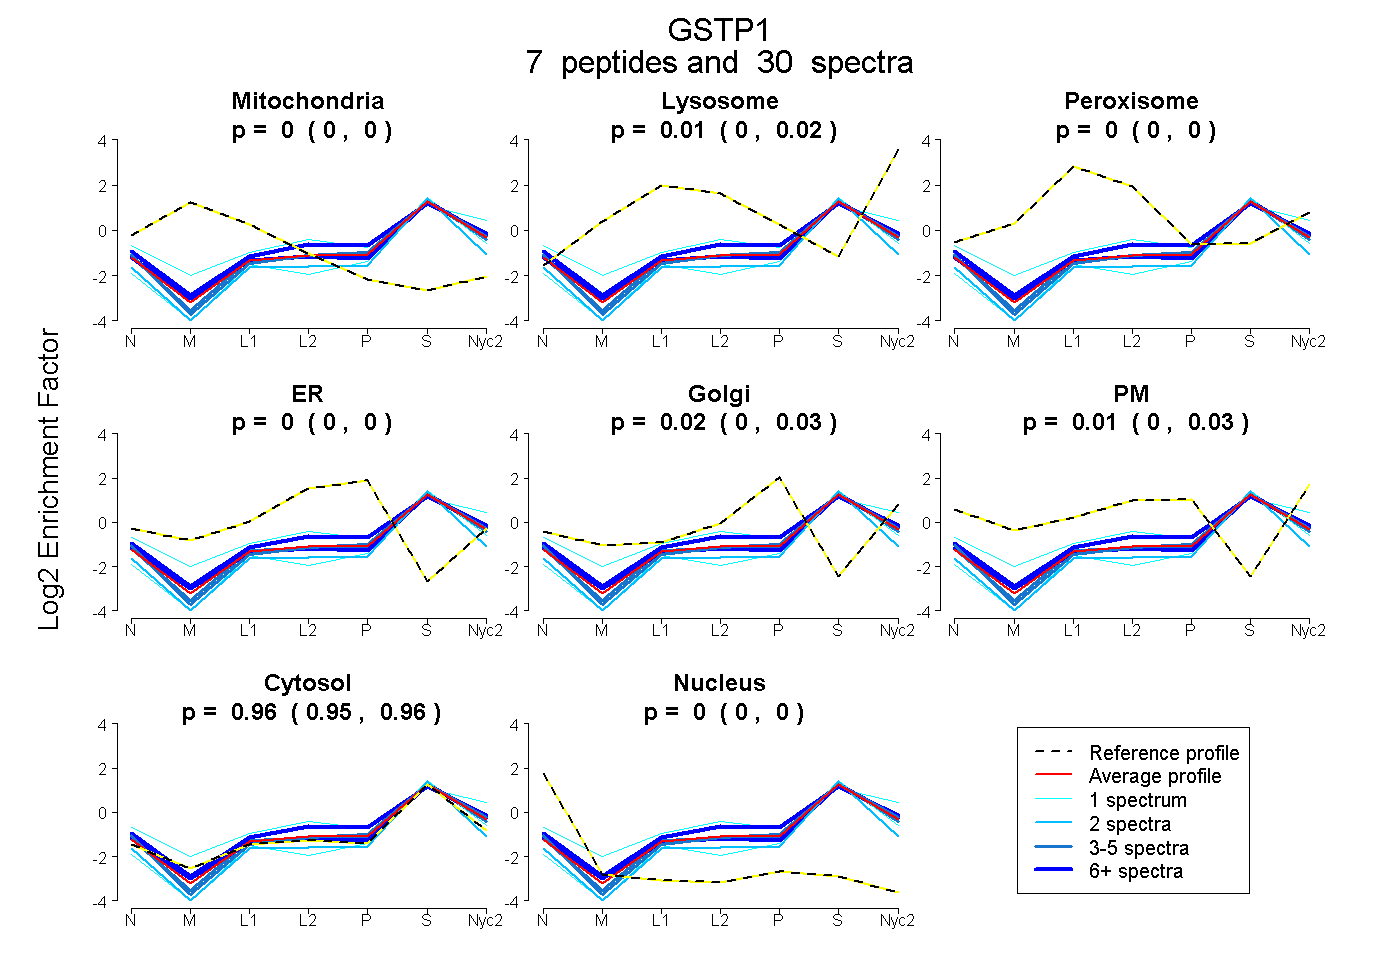
0.000 | 0.000
0.000 | 0.019
0.000 | 0.000
0.000 | 0.000
0.000 | 0.032
0.000 | 0.034
0.953 | 0.964
0.000 | 0.000
2peptides
spectra
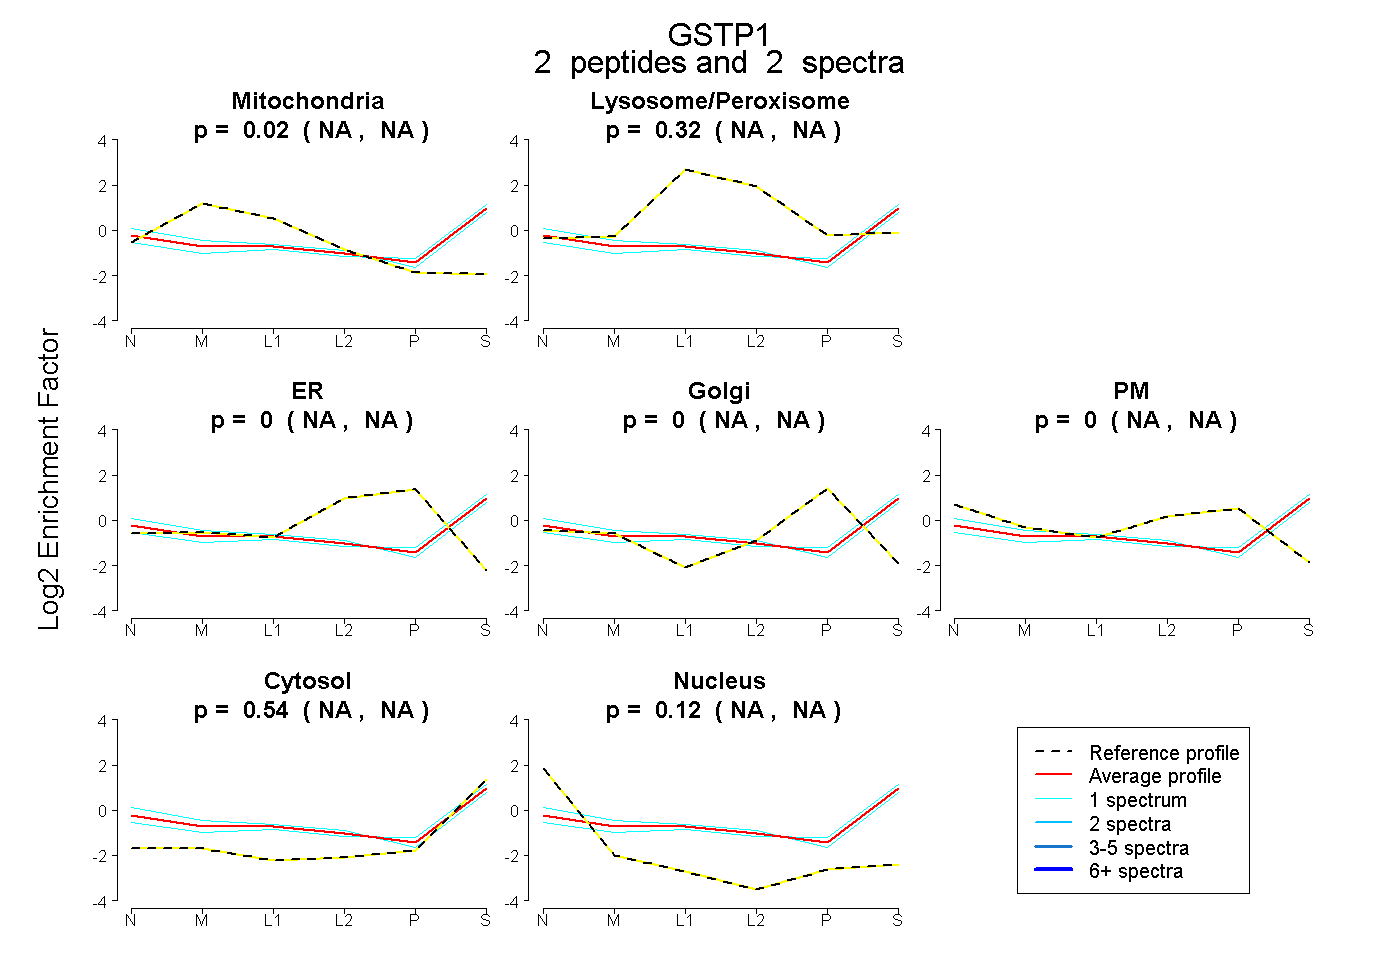
NA | NA
NA | NA
NA | NA
NA | NA
NA | NA
NA | NA
NA | NA
5peptides
spectra
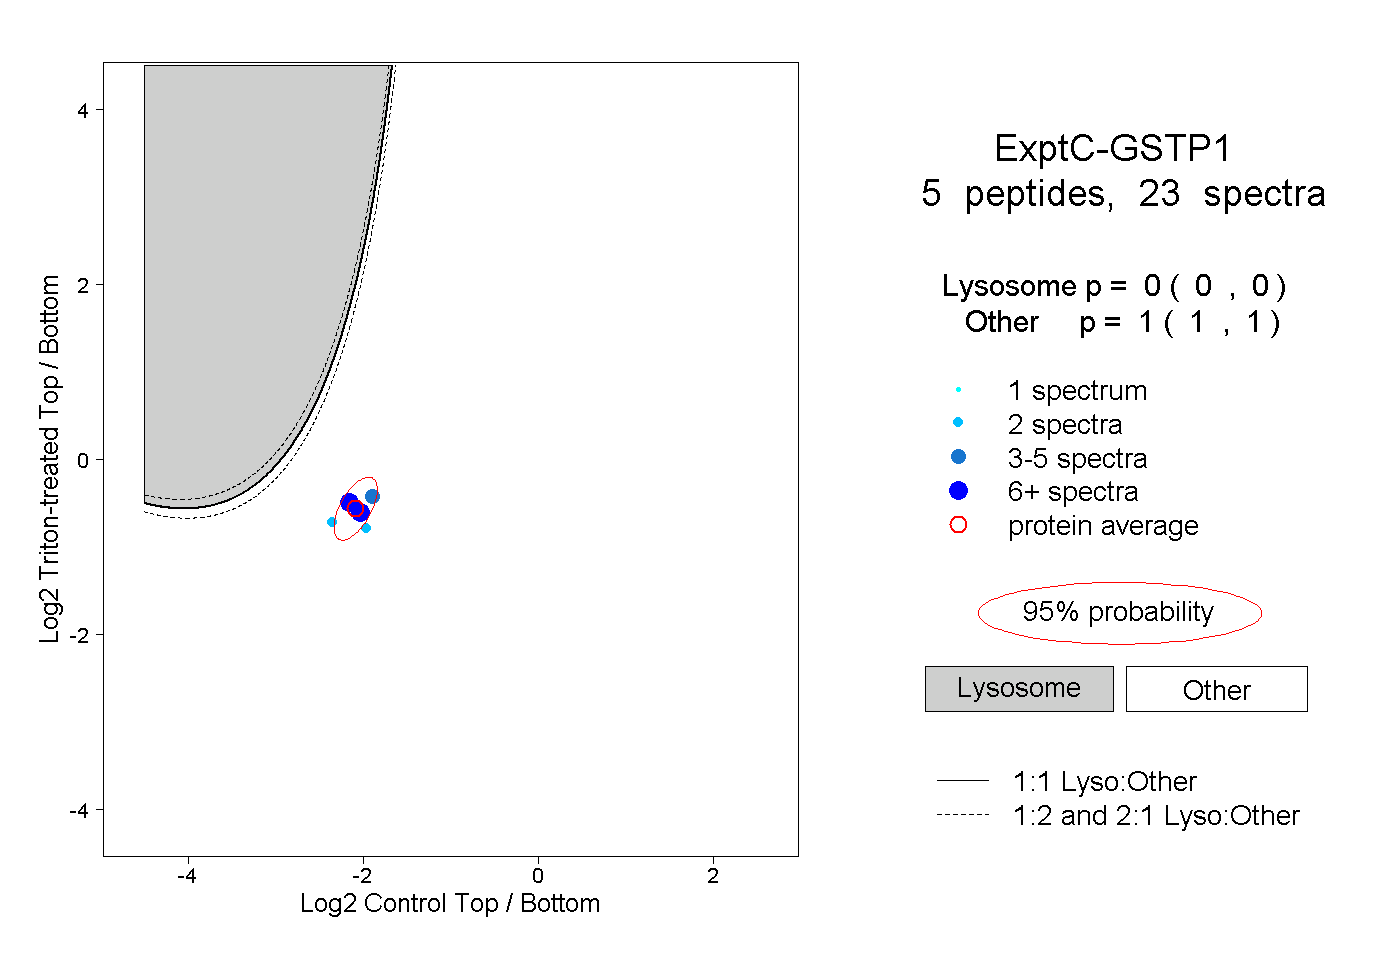
0.000 | 0.000
1.000 | 1.000