 7
7peptides
spectra
0.000 | 0.000
0.000 | 0.019
0.000 | 0.000
0.000 | 0.000
0.000 | 0.032
0.000 | 0.034
0.953 | 0.964
0.000 | 0.000
| Plot | Mito | Lyso | Perox | ER | Golgi | PM | Cytosol | Nucleus | |||||
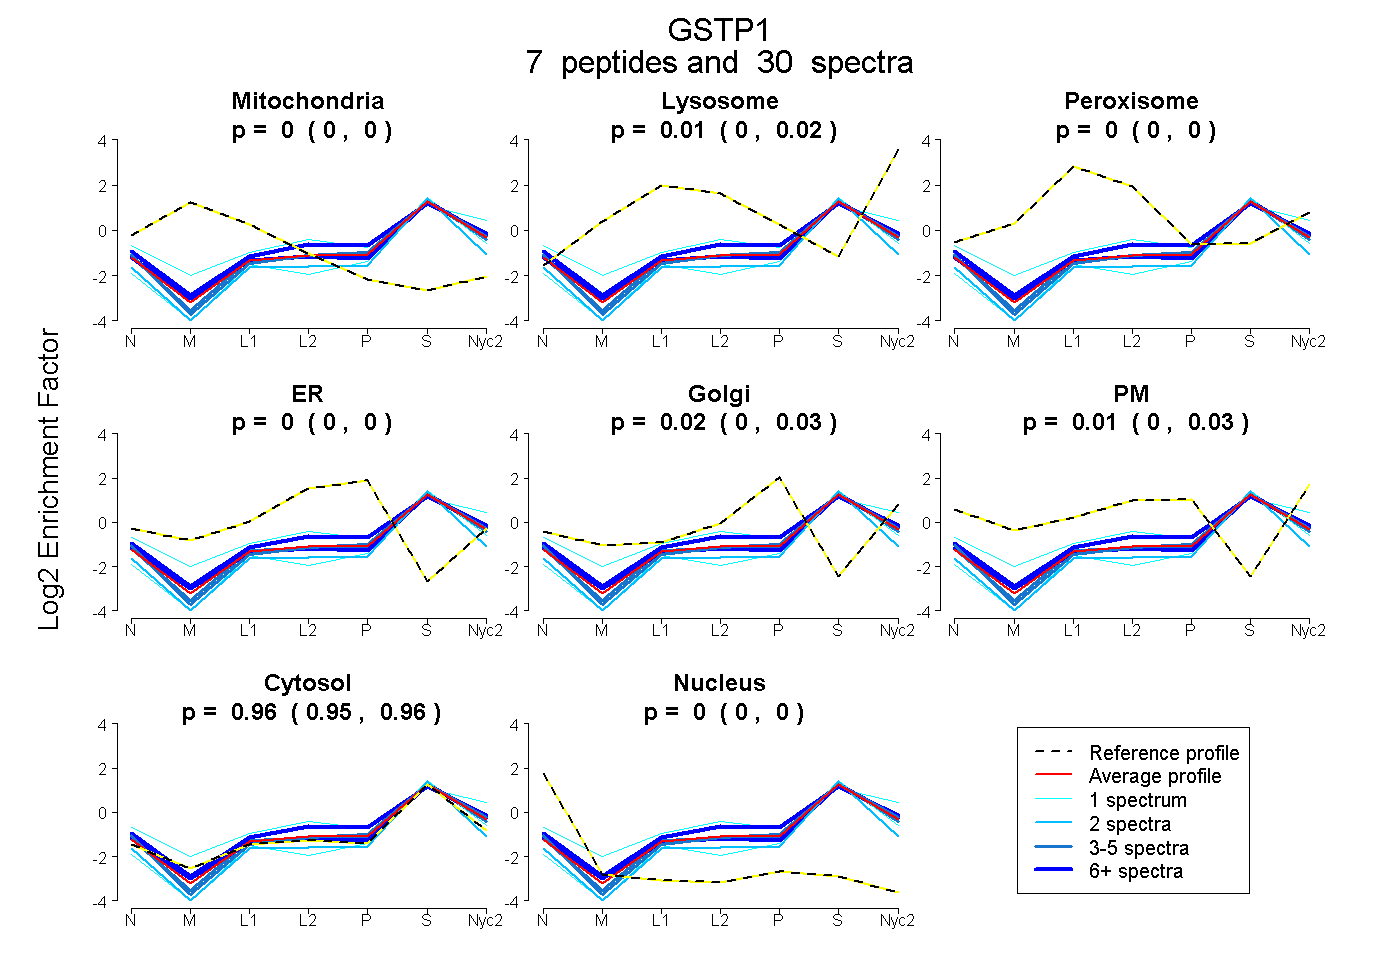
| Expt A |
7 peptides |
30 spectra |
|
0.000 0.000 | 0.000 |
0.012 0.000 | 0.019 |
0.000 0.000 | 0.000 |
0.000 0.000 | 0.000 |
0.021 0.000 | 0.032 |
0.009 0.000 | 0.034 |
0.959 0.953 | 0.964 |
0.000 0.000 | 0.000 |
| 1 spectrum, MPPYTIVYFPVR | 0.000 | 0.000 | 0.000 | 0.000 | 0.000 | 0.000 | 1.000 | 0.000 | ||
| 3 spectra, FEDGDLTLYQSNAILR | 0.000 | 0.000 | 0.000 | 0.000 | 0.015 | 0.000 | 0.985 | 0.000 | ||
| 12 spectra, PPYTIVYFPVR | 0.000 | 0.024 | 0.000 | 0.000 | 0.000 | 0.016 | 0.960 | 0.000 | ||
| 1 spectrum, EAALVDMVNDGVEDLR | 0.000 | 0.131 | 0.000 | 0.000 | 0.000 | 0.124 | 0.745 | 0.000 | ||
| 4 spectra, SLGLYGK | 0.000 | 0.000 | 0.000 | 0.000 | 0.032 | 0.000 | 0.968 | 0.000 | ||
| 2 spectra, STCLYGQLPK | 0.000 | 0.000 | 0.000 | 0.000 | 0.000 | 0.000 | 0.982 | 0.018 | ||
| 7 spectra, LSARPK | 0.000 | 0.023 | 0.000 | 0.000 | 0.000 | 0.116 | 0.861 | 0.000 |
| Plot | Mito | Lyso or Perox | ER | Golgi | PM | Cytosol | Nucleus | ||||||
| Expt B |
2 peptides |
2 spectra |
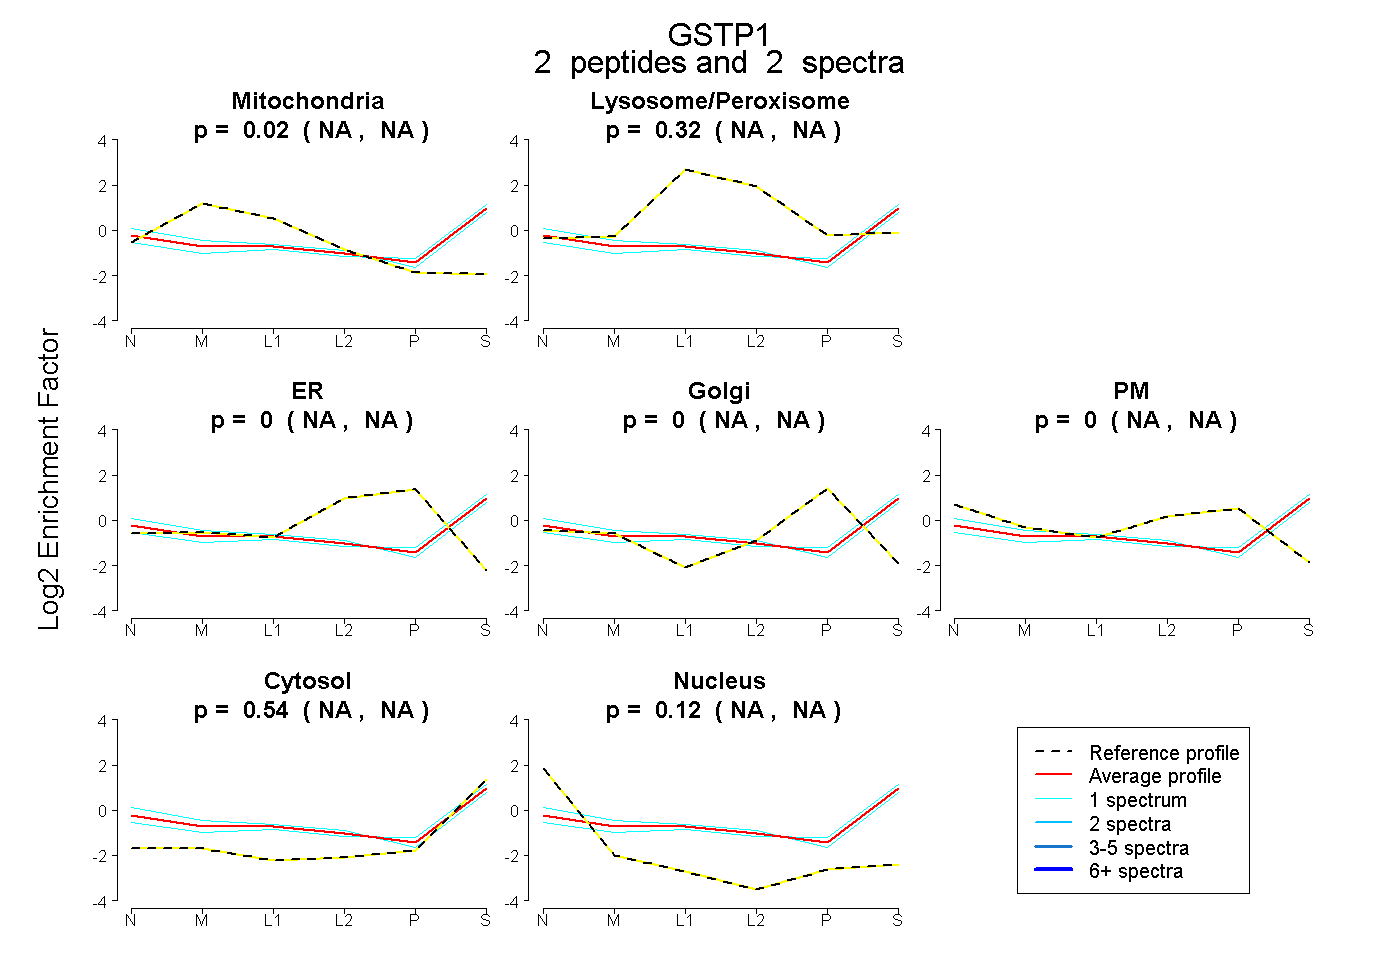 |
0.015 NA | NA |
0.318 NA | NA |
0.000 NA | NA |
0.000 NA | NA |
0.000 NA | NA |
0.544 NA | NA |
0.122 NA | NA |
|||
| Plot | Lyso | Other | |||||||||||
| Expt C |
5 peptides |
23 spectra |
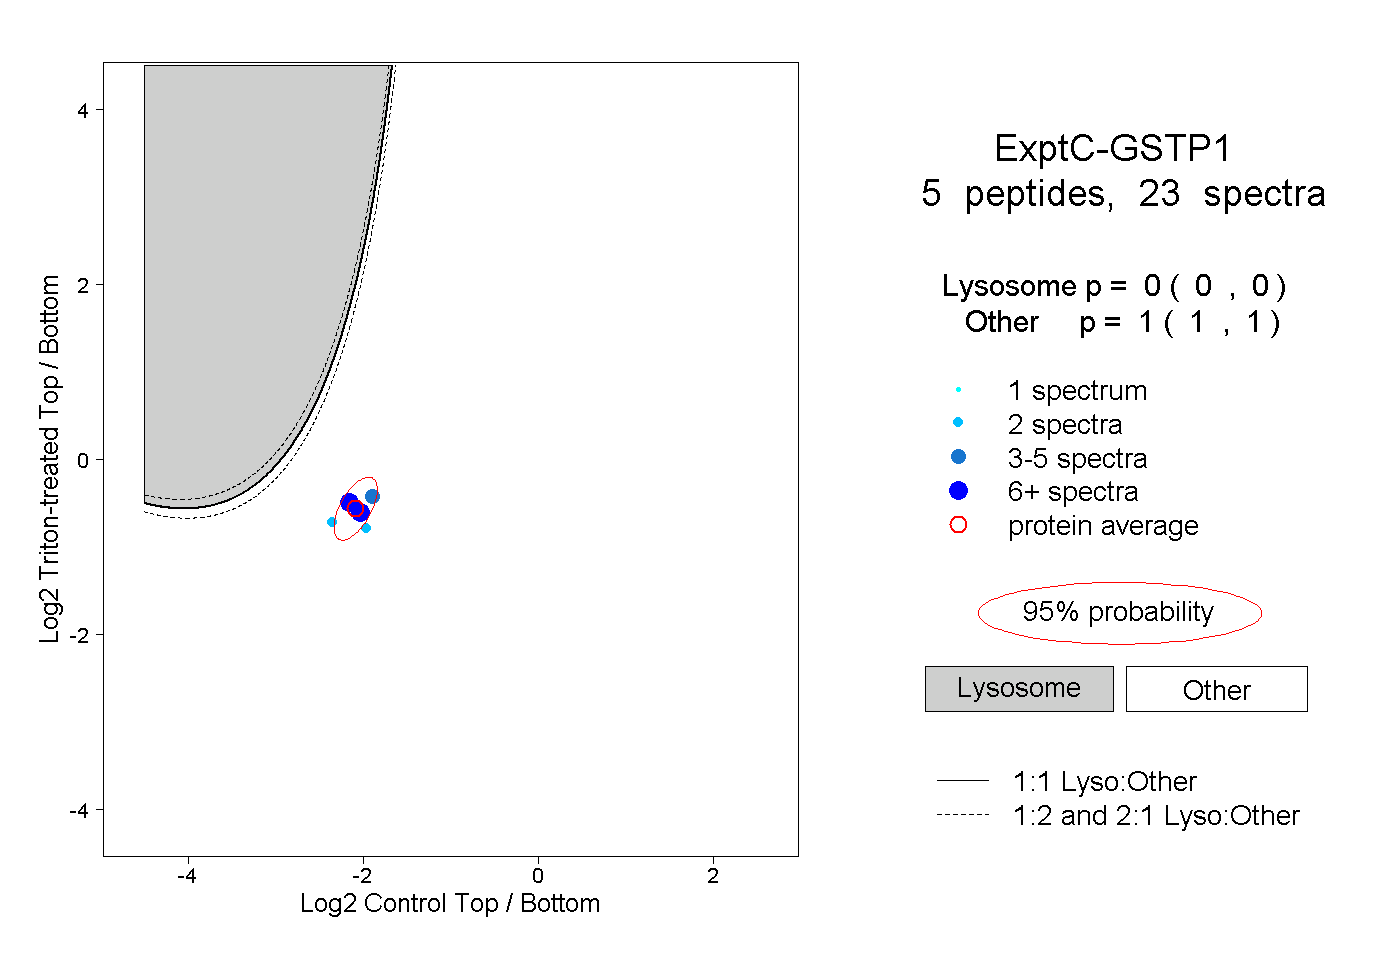 |
0.000 0.000 | 0.000 |
1.000 1.000 | 1.000 |