 6
6peptides
spectra
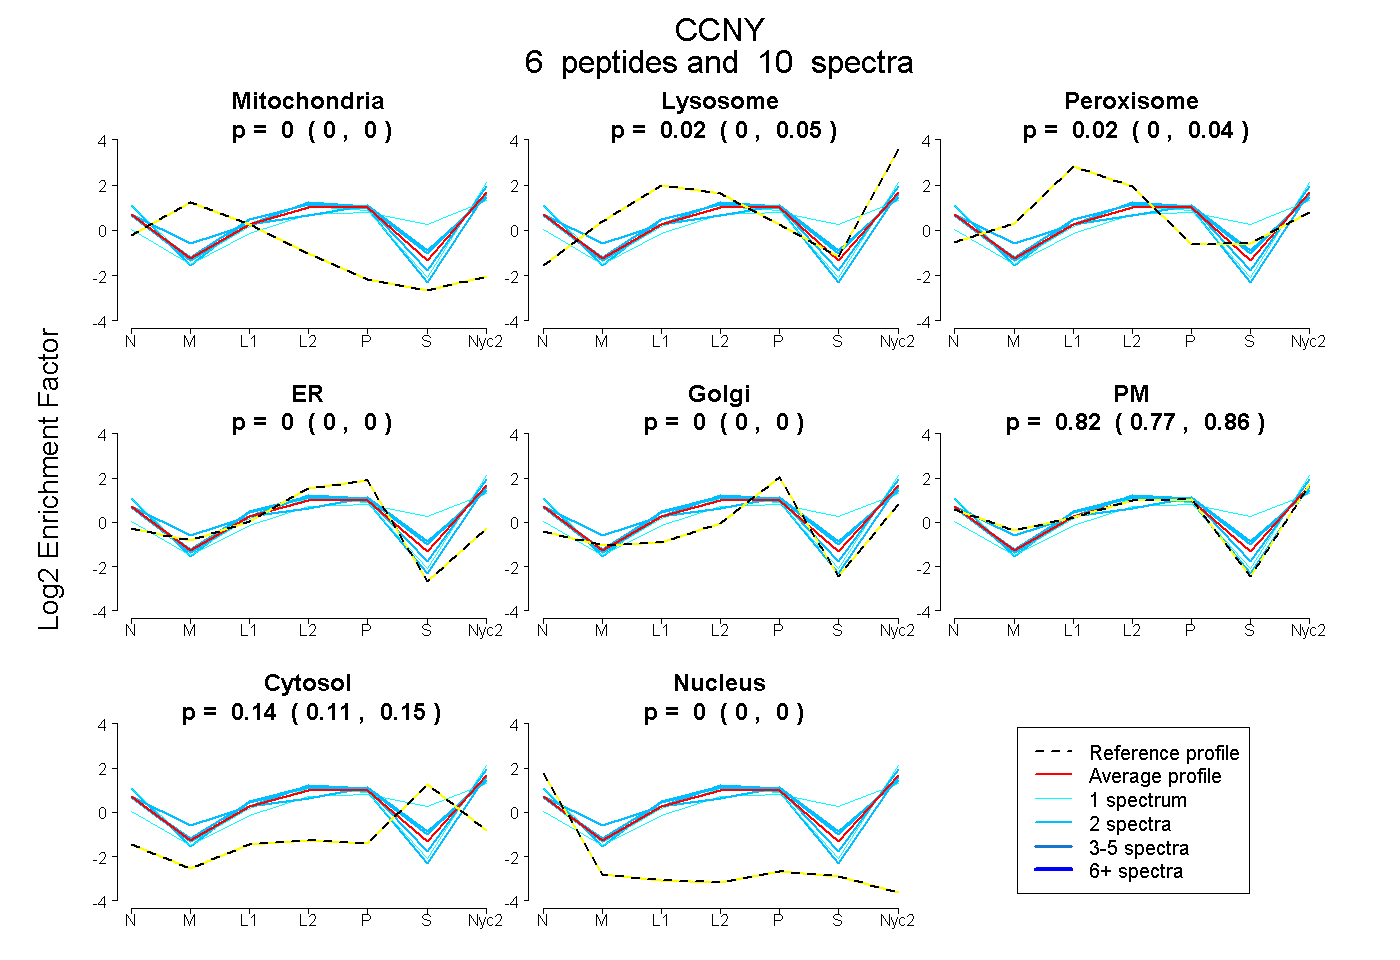
0.000 | 0.000
0.000 | 0.049
0.000 | 0.041
0.000 | 0.000
0.000 | 0.000
0.774 | 0.855
0.115 | 0.153
0.000 | 0.000
2peptides
spectra
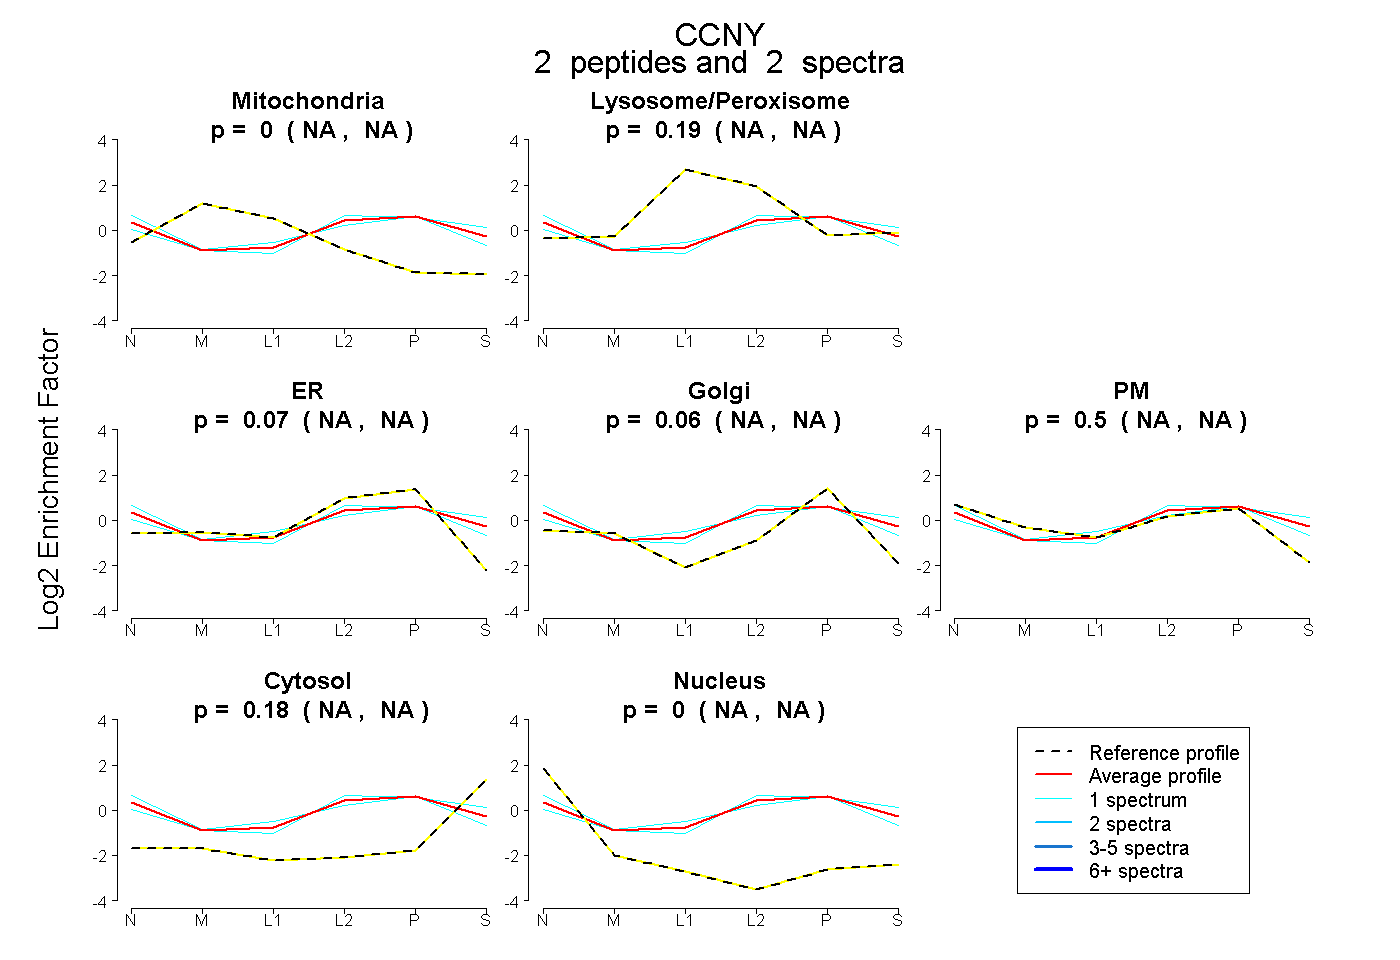
NA | NA
NA | NA
NA | NA
NA | NA
NA | NA
NA | NA
NA | NA
5peptides
spectra
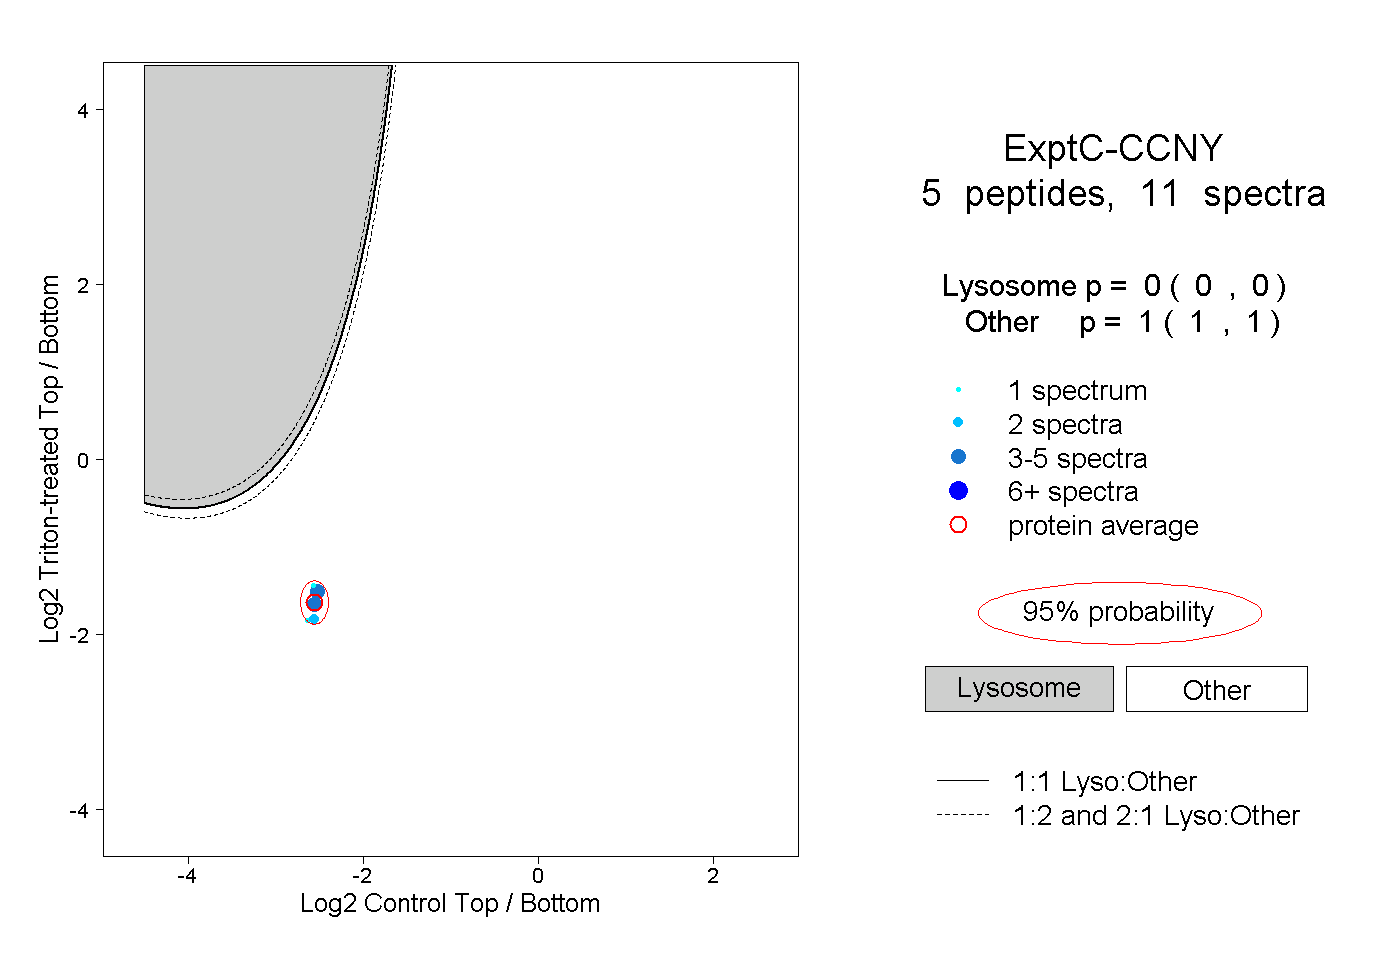
0.000 | 0.000
1.000 | 1.000