 6
6peptides
spectra
0.000 | 0.000
0.000 | 0.049
0.000 | 0.041
0.000 | 0.000
0.000 | 0.000
0.774 | 0.855
0.115 | 0.153
0.000 | 0.000
2peptides
spectra
NA | NA
NA | NA
NA | NA
NA | NA
NA | NA
NA | NA
NA | NA
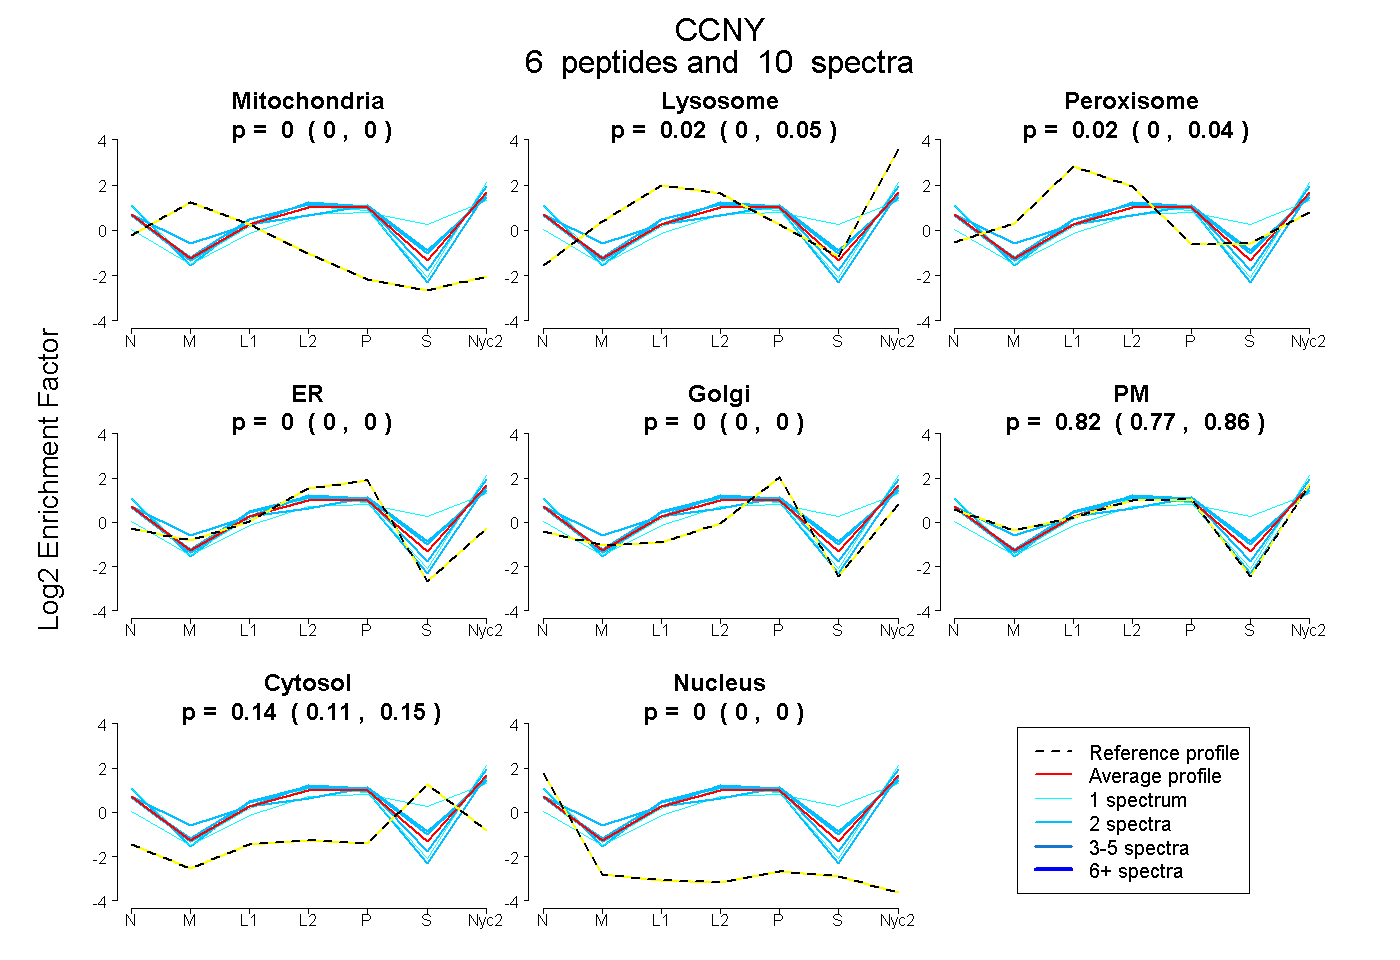
| Plot | Mito | Lyso | Perox | ER | Golgi | PM | Cytosol | Nucleus | |||||
| Expt A |
6 peptides |
10 spectra |
|
0.000 0.000 | 0.000 |
0.023 0.000 | 0.049 |
0.023 0.000 | 0.041 |
0.000 0.000 | 0.000 |
0.000 0.000 | 0.000 |
0.819 0.774 | 0.855 |
0.135 0.115 | 0.153 |
0.000 0.000 | 0.000 |
||
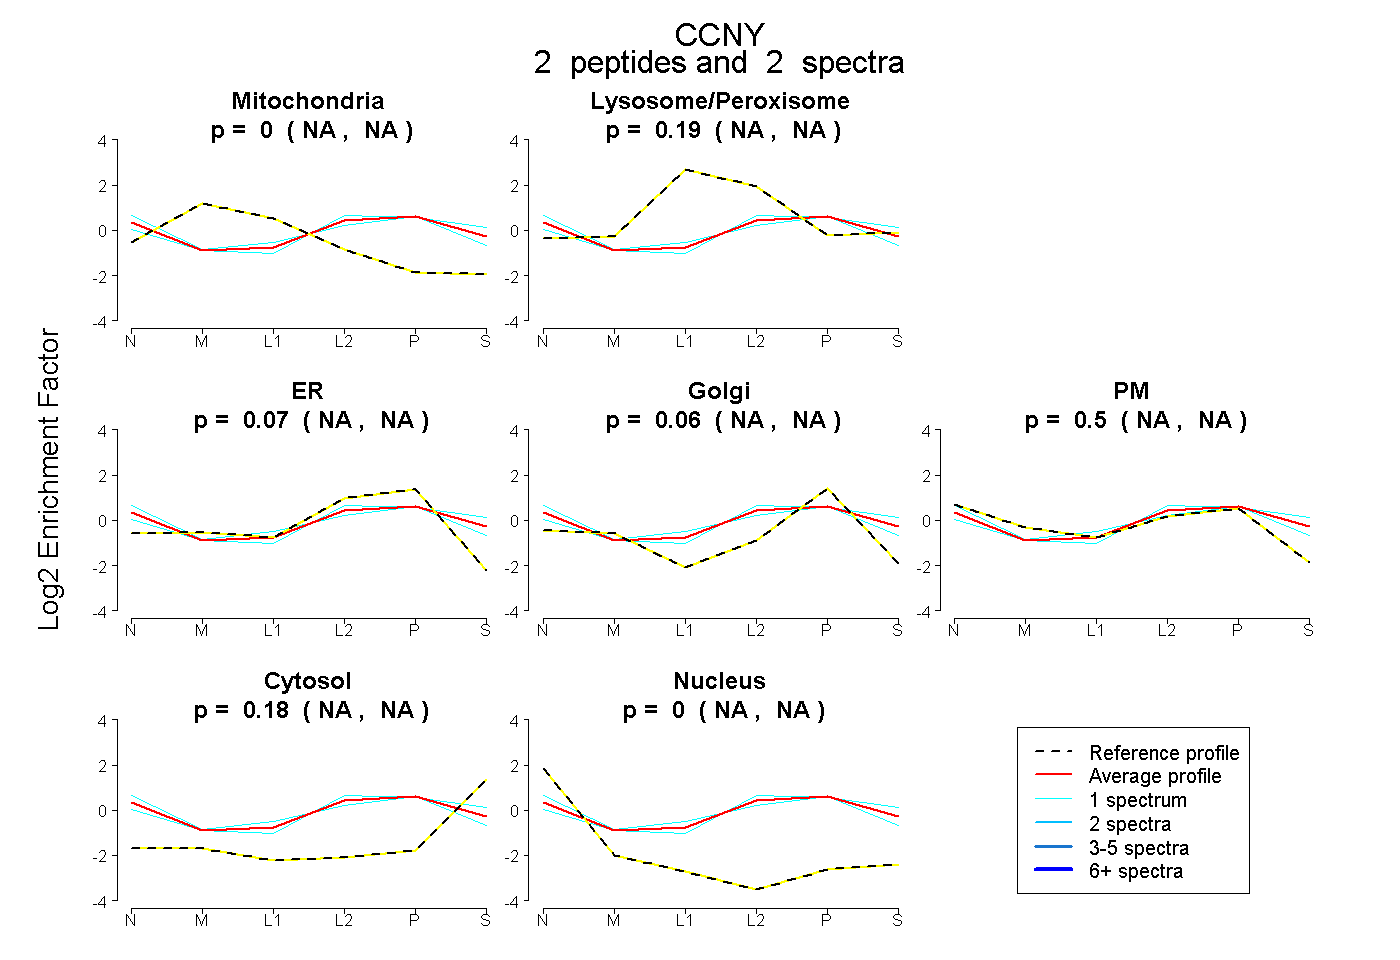
| Plot | Mito | Lyso or Perox | ER | Golgi | PM | Cytosol | Nucleus | ||||||
| Expt B |
2 peptides |
2 spectra |
|
0.000 NA | NA |
0.186 NA | NA |
0.068 NA | NA |
0.058 NA | NA |
0.504 NA | NA |
0.183 NA | NA |
0.000 NA | NA |
| 1 spectrum, LESYRPDTDLSR | 0.000 | 0.157 | 0.000 | 0.025 | 0.698 | 0.120 | 0.000 | |||
| 1 spectrum, ASTIFLSK | 0.000 | 0.176 | 0.270 | 0.000 | 0.284 | 0.270 | 0.000 |
| Plot | Lyso | Other | |||||||||||
| Expt C |
5 peptides |
11 spectra |
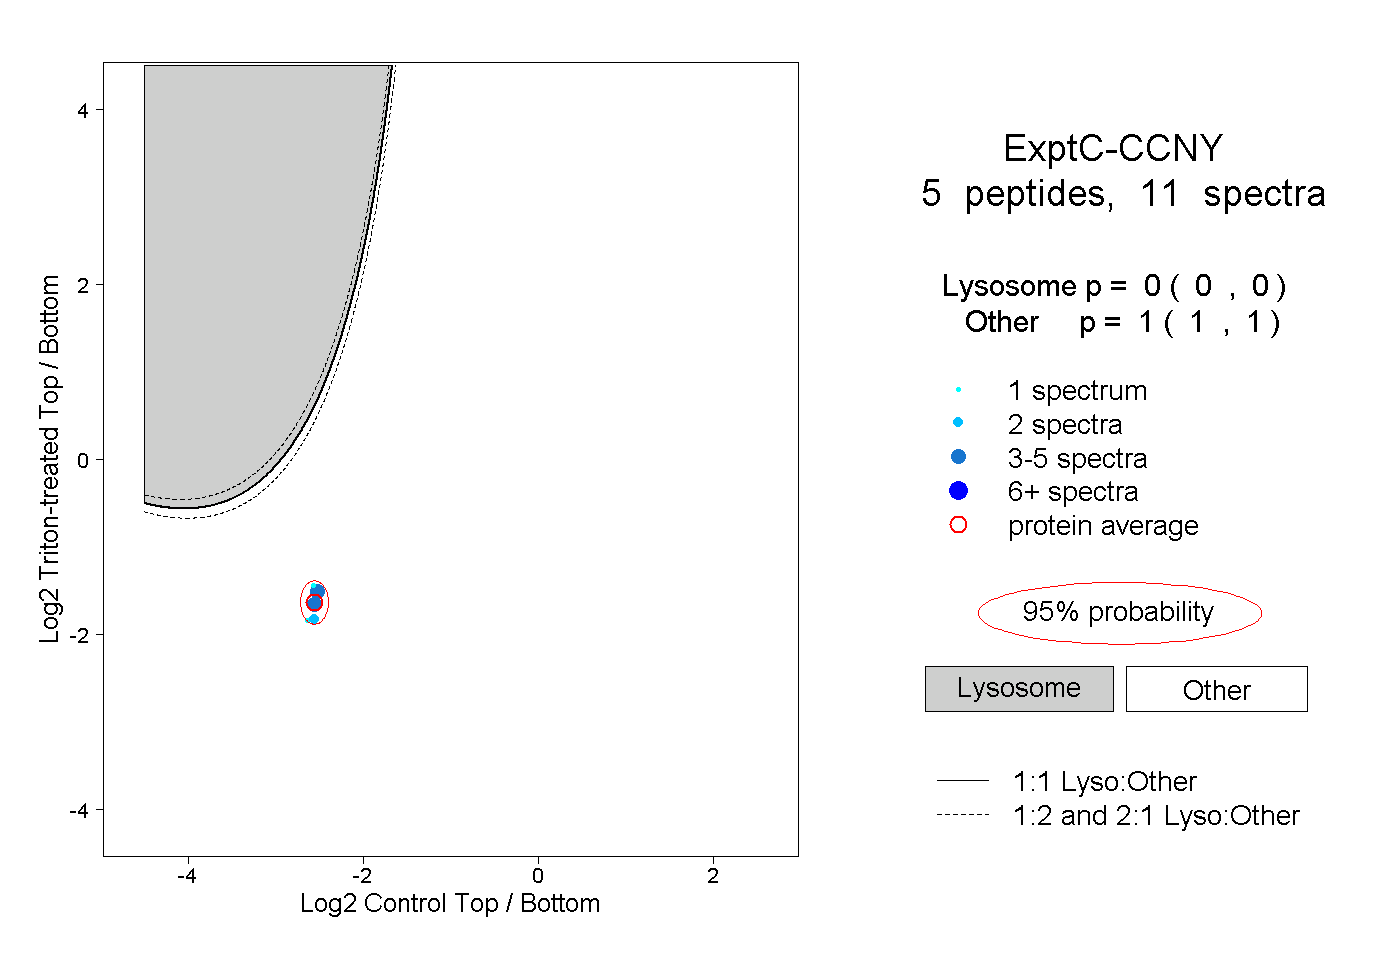 |
0.000 0.000 | 0.000 |
1.000 1.000 | 1.000 |