 15
15peptides
spectra
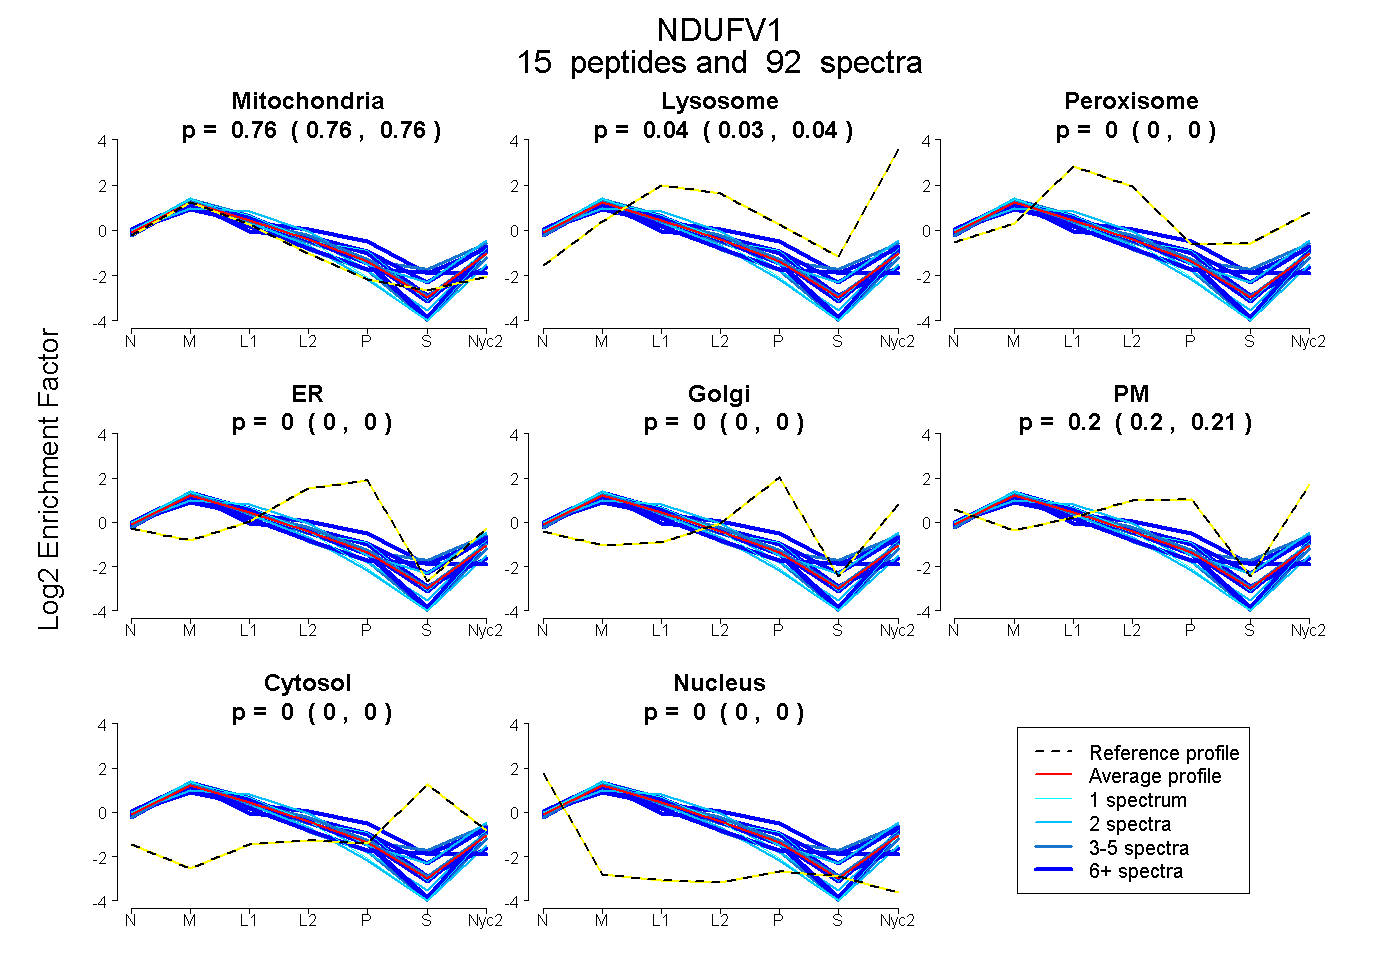
0.757 | 0.763
0.030 | 0.041
0.000 | 0.000
0.000 | 0.000
0.000 | 0.000
0.197 | 0.209
0.000 | 0.000
0.000 | 0.000
14peptides
spectra
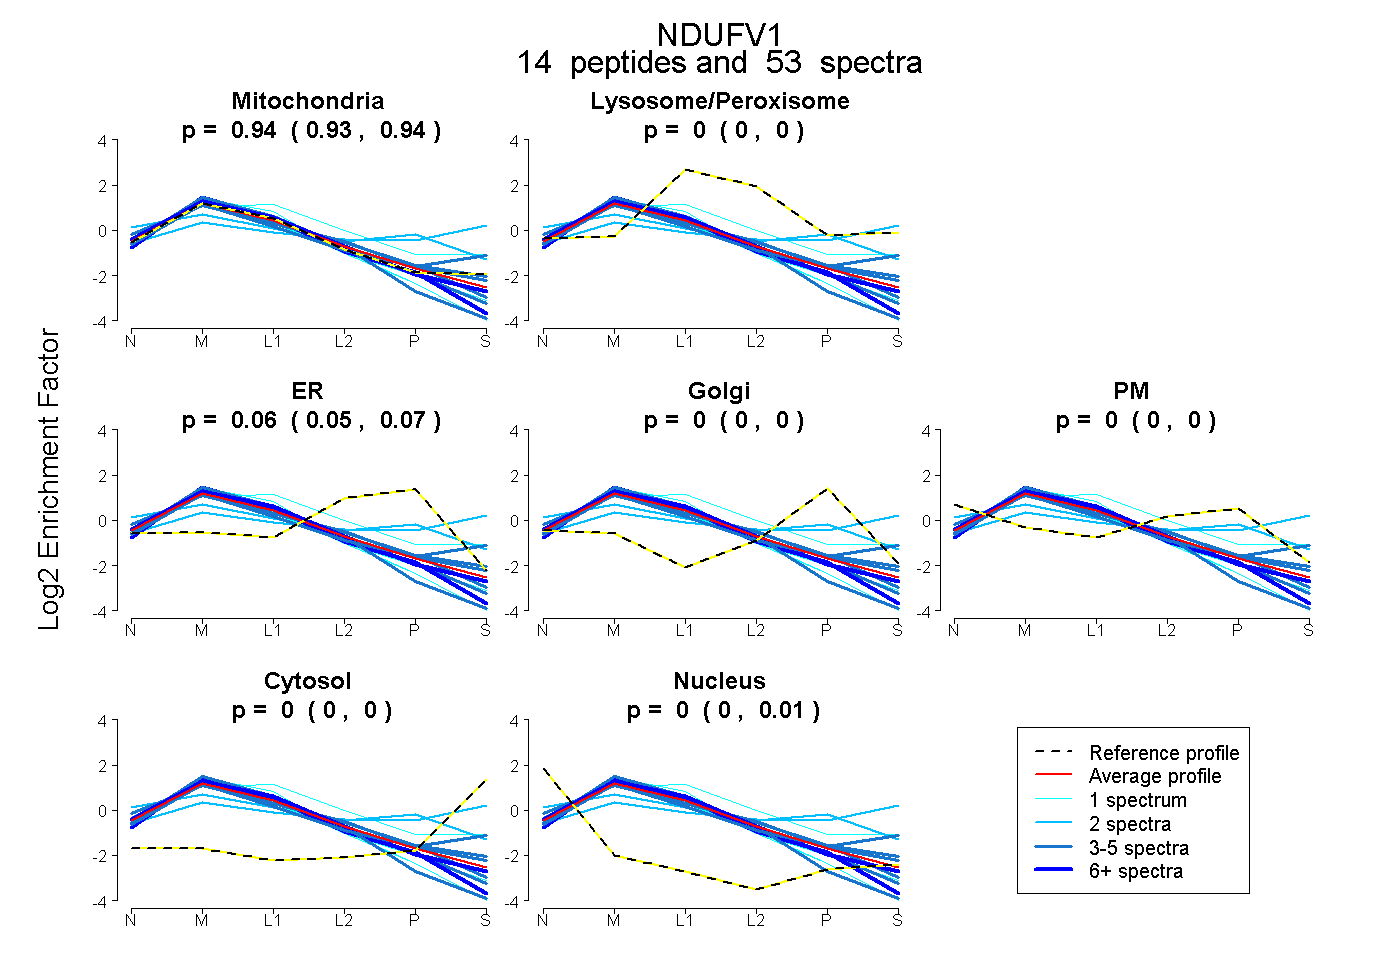
0.929 | 0.944
0.000 | 0.000
0.049 | 0.065
0.000 | 0.000
0.000 | 0.000
0.000 | 0.000
0.001 | 0.007
18peptides
spectra
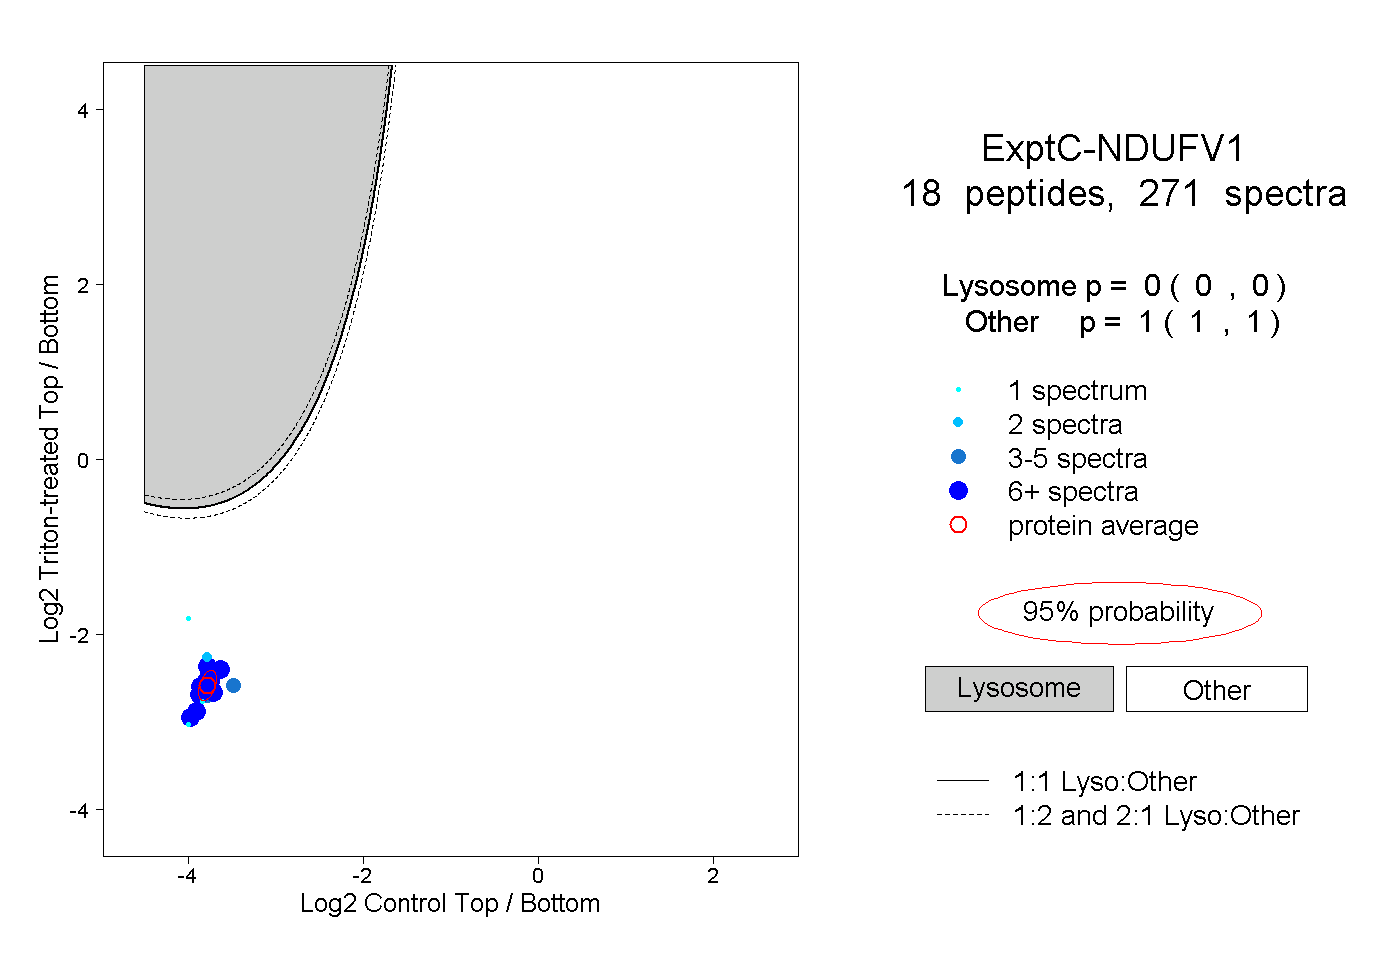
0.000 | 0.000
1.000 | 1.000
9peptides
spectra
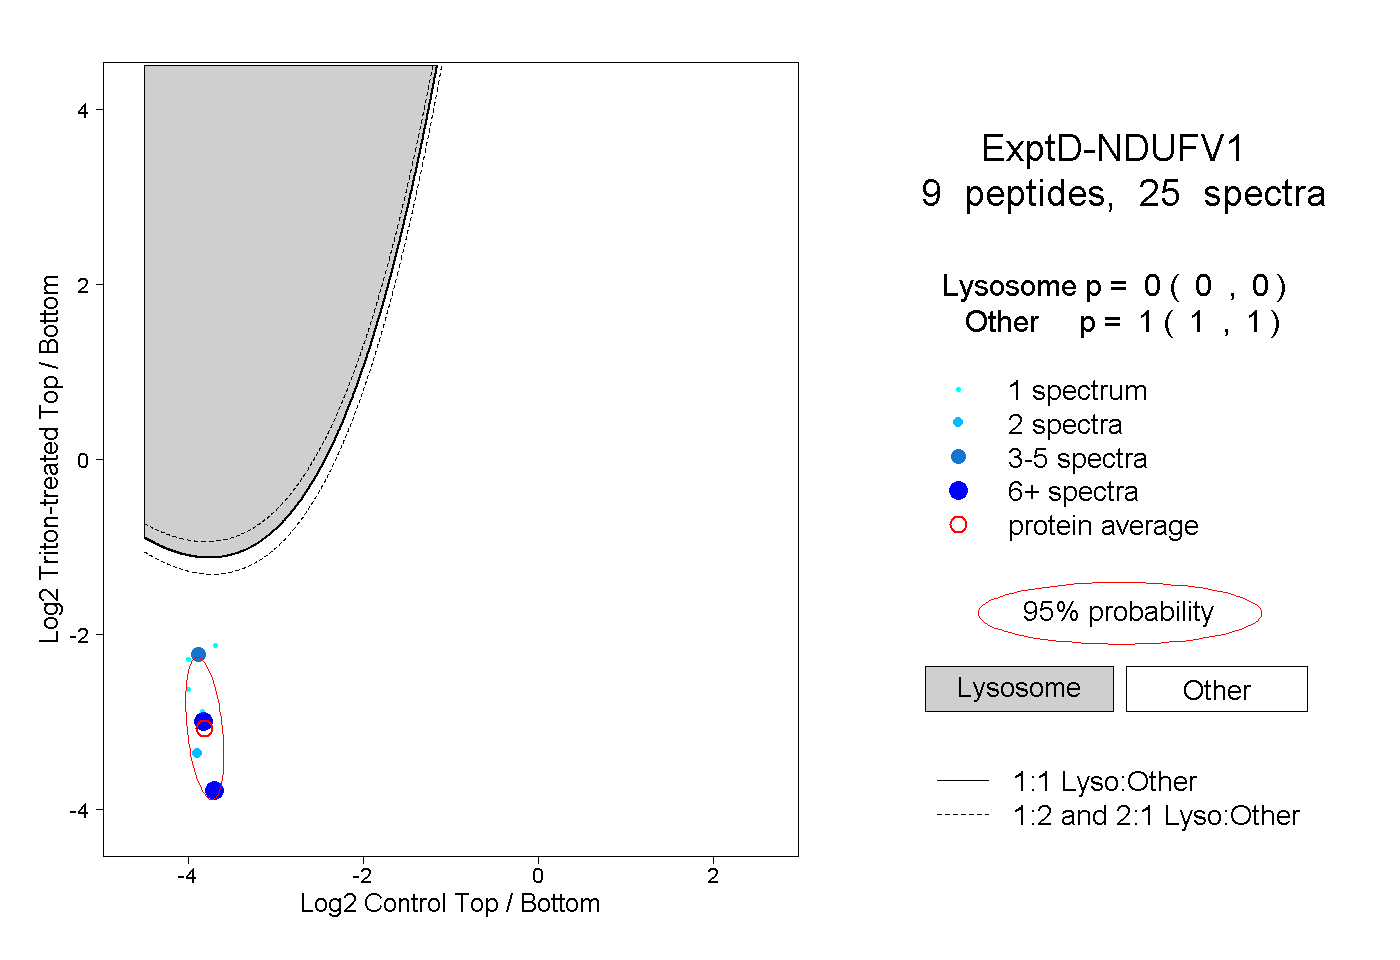
0.000 | 0.000
1.000 | 1.000