 3
3peptides
spectra
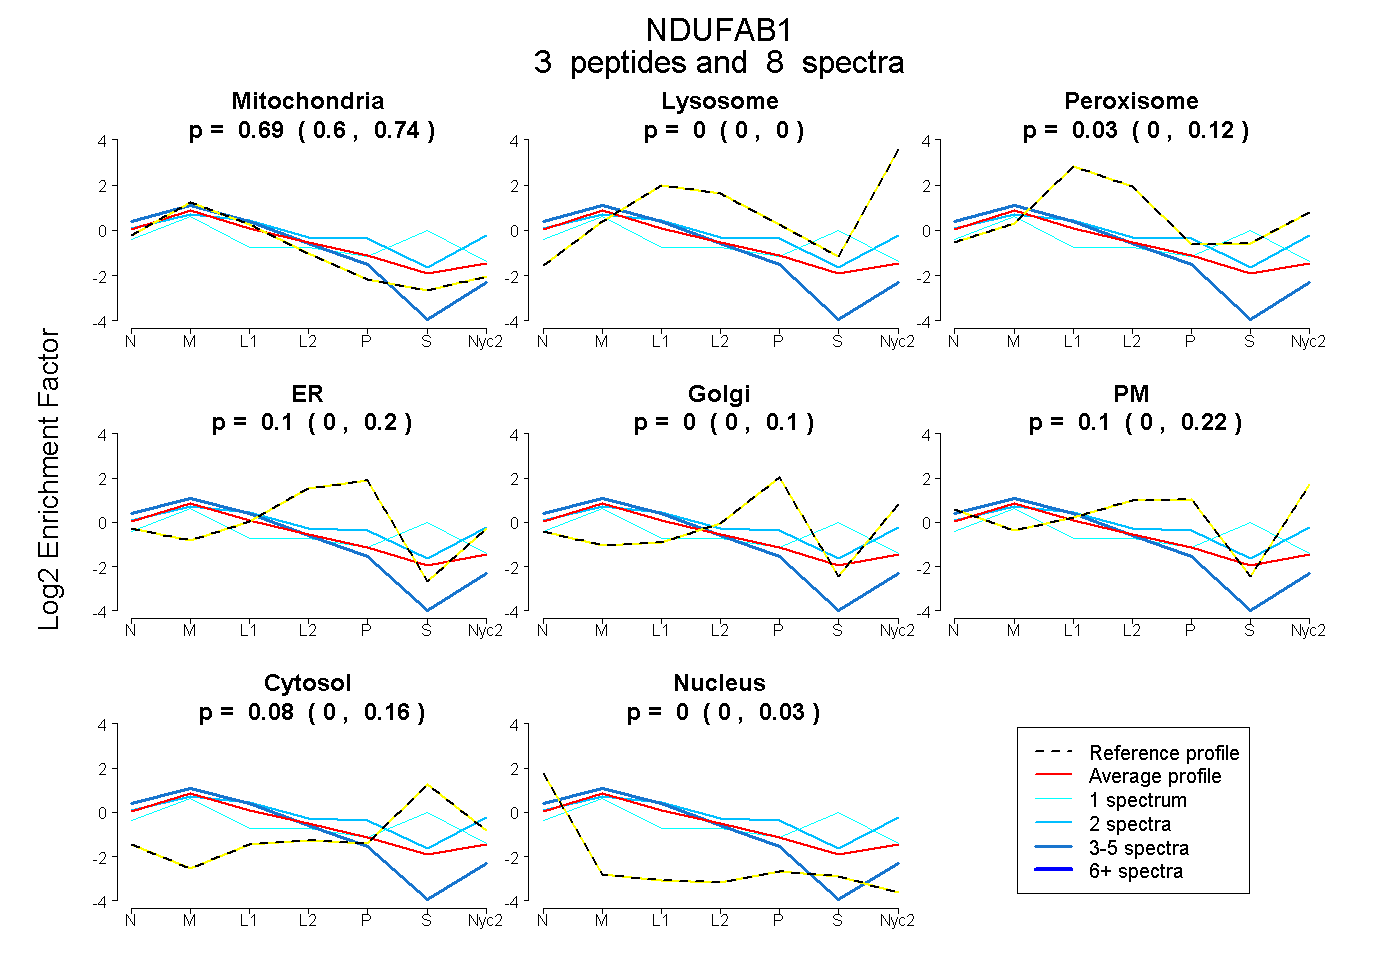
0.601 | 0.741
0.000 | 0.000
0.000 | 0.121
0.000 | 0.202
0.000 | 0.101
0.000 | 0.219
0.000 | 0.158
0.000 | 0.034
2peptides
spectra
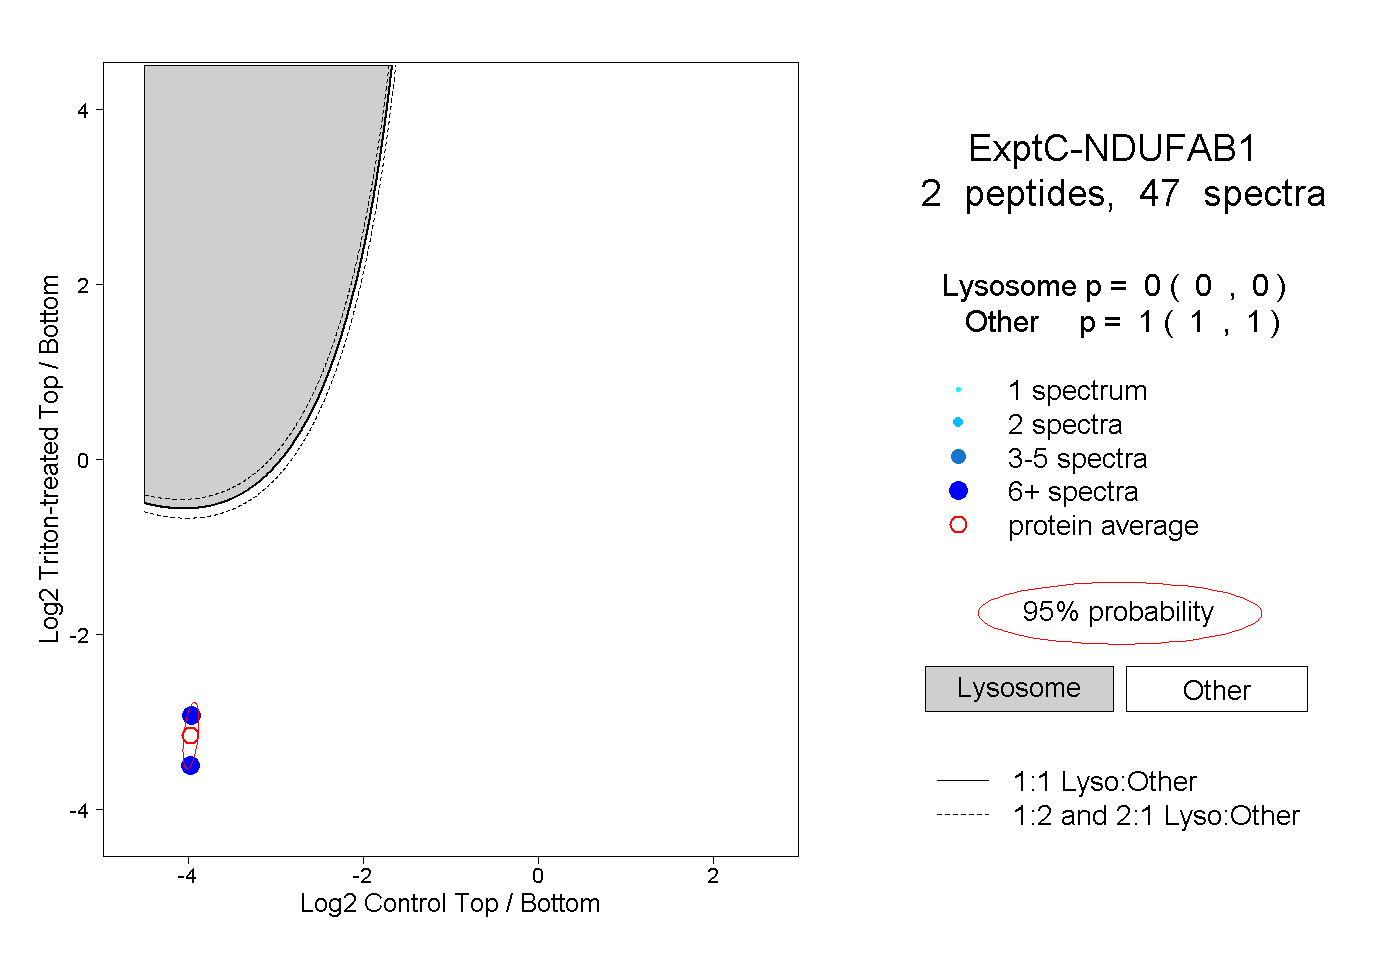
0.000 | 0.000
1.000 | 1.000
1peptide
spectra
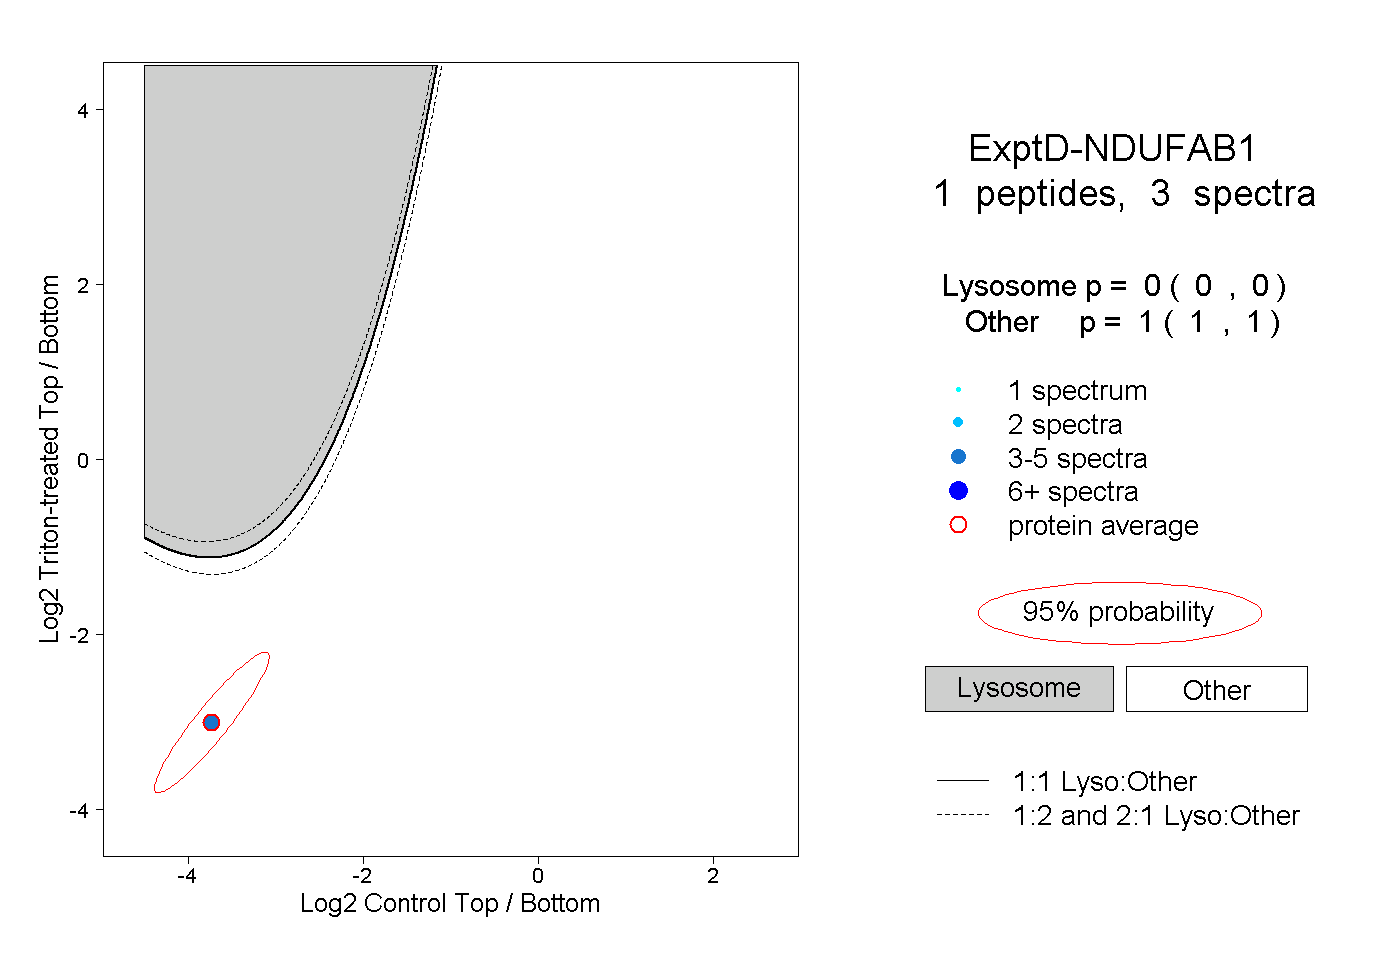
0.000 | 0.000
1.000 | 1.000