 3
3peptides
spectra
0.601 | 0.741
0.000 | 0.000
0.000 | 0.121
0.000 | 0.202
0.000 | 0.101
0.000 | 0.219
0.000 | 0.158
0.000 | 0.034
| Plot | Mito | Lyso | Perox | ER | Golgi | PM | Cytosol | Nucleus | |||||
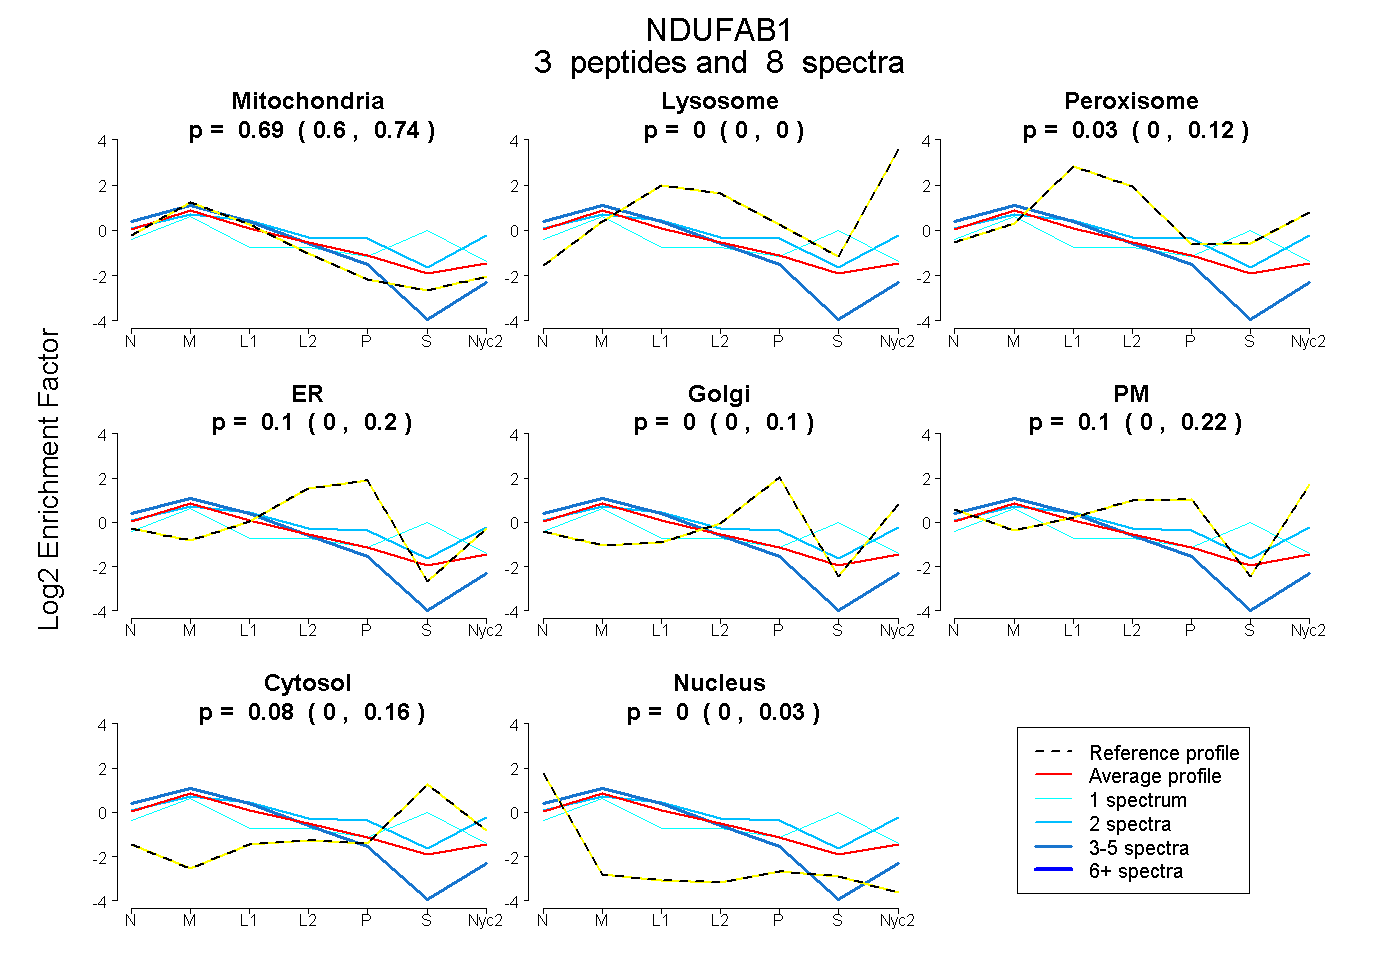
| Expt A |
3 peptides |
8 spectra |
|
0.694 0.601 | 0.741 |
0.000 0.000 | 0.000 |
0.026 0.000 | 0.121 |
0.104 0.000 | 0.202 |
0.000 0.000 | 0.101 |
0.097 0.000 | 0.219 |
0.079 0.000 | 0.158 |
0.000 0.000 | 0.034 |
| 1 spectrum, LSVNSHFMK | 0.480 | 0.000 | 0.087 | 0.000 | 0.025 | 0.000 | 0.408 | 0.000 | ||
| 5 spectra, VLYVLK | 0.850 | 0.000 | 0.000 | 0.121 | 0.000 | 0.000 | 0.000 | 0.029 | ||
| 2 spectra, LMCPQEIVDYIADK | 0.438 | 0.014 | 0.144 | 0.000 | 0.099 | 0.253 | 0.052 | 0.000 |
| Plot | Lyso | Other | |||||||||||
| Expt C |
2 peptides |
47 spectra |
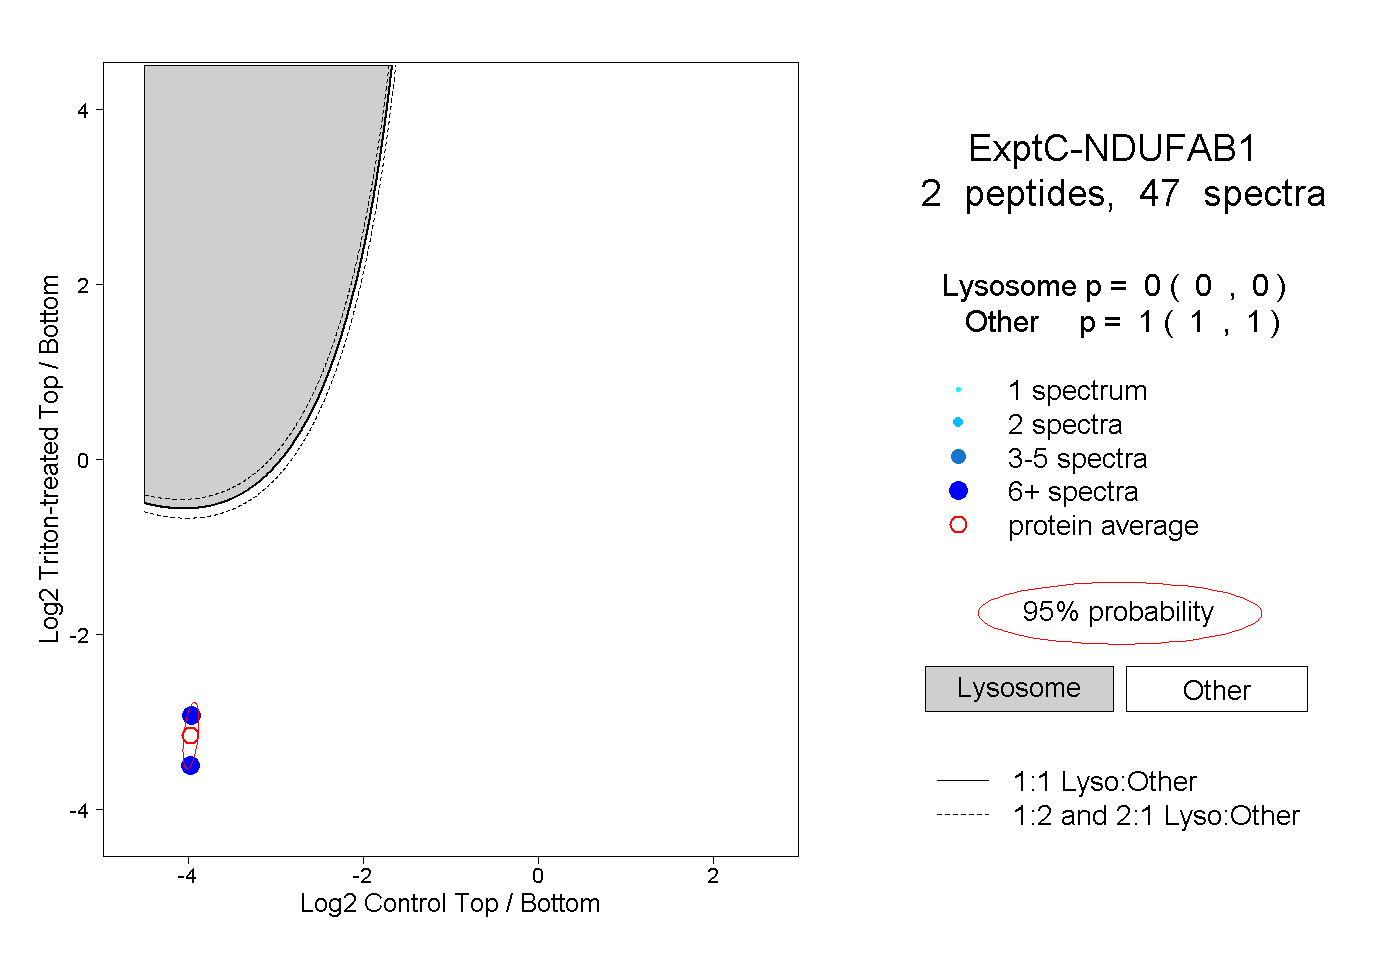 |
0.000 0.000 | 0.000 |
1.000 1.000 | 1.000 |
||||||||
| Plot | Lyso | Other | |||||||||||
| Expt D |
1 peptide |
3 spectra |
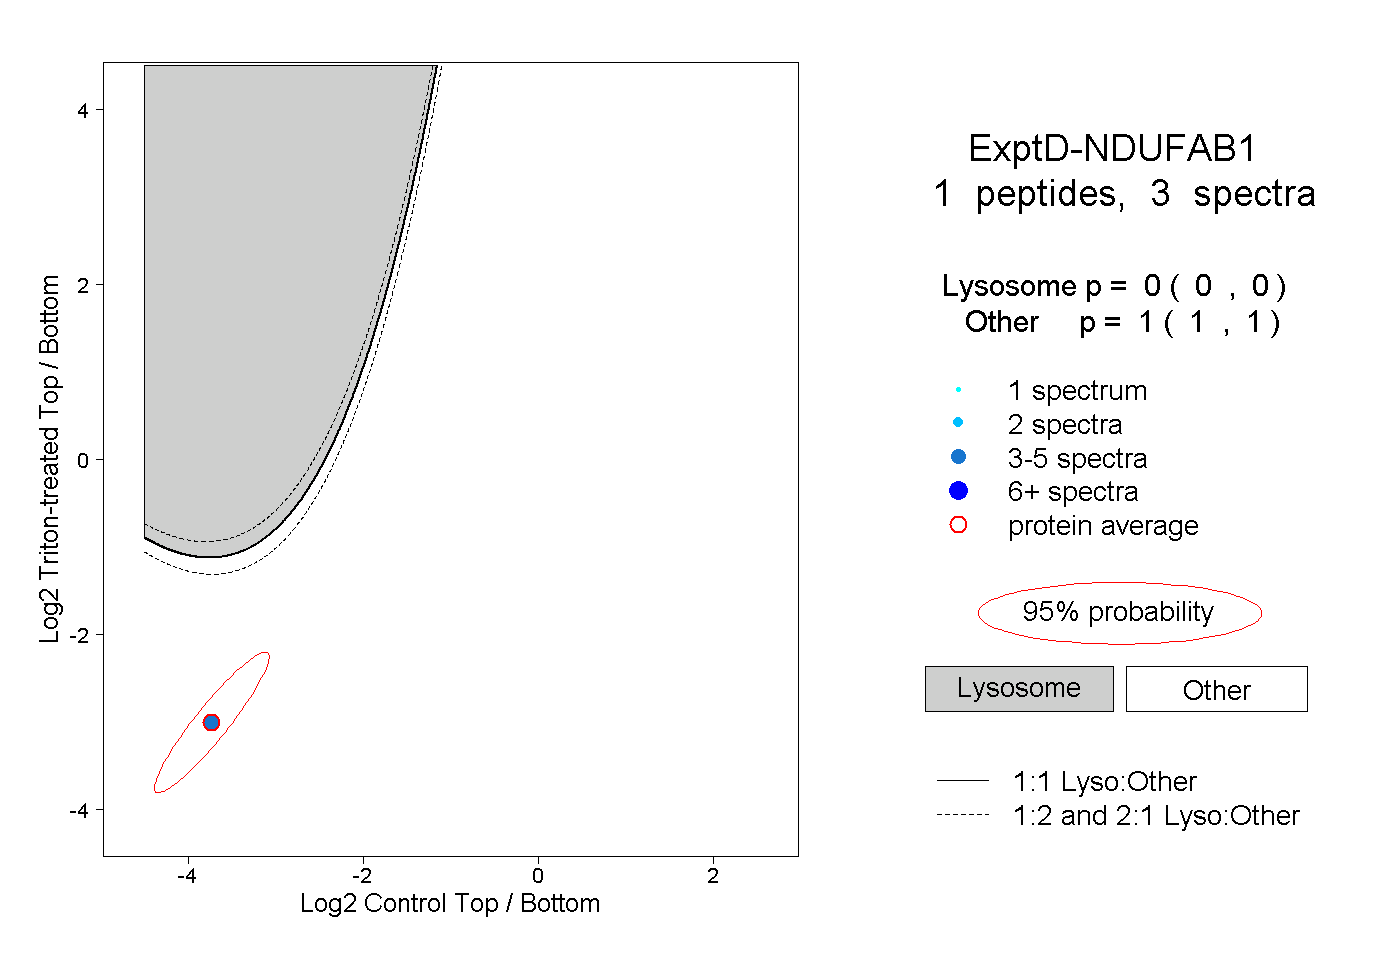 |
0.000 0.000 | 0.000 |
1.000 1.000 | 1.000 |