 10
10peptides
spectra
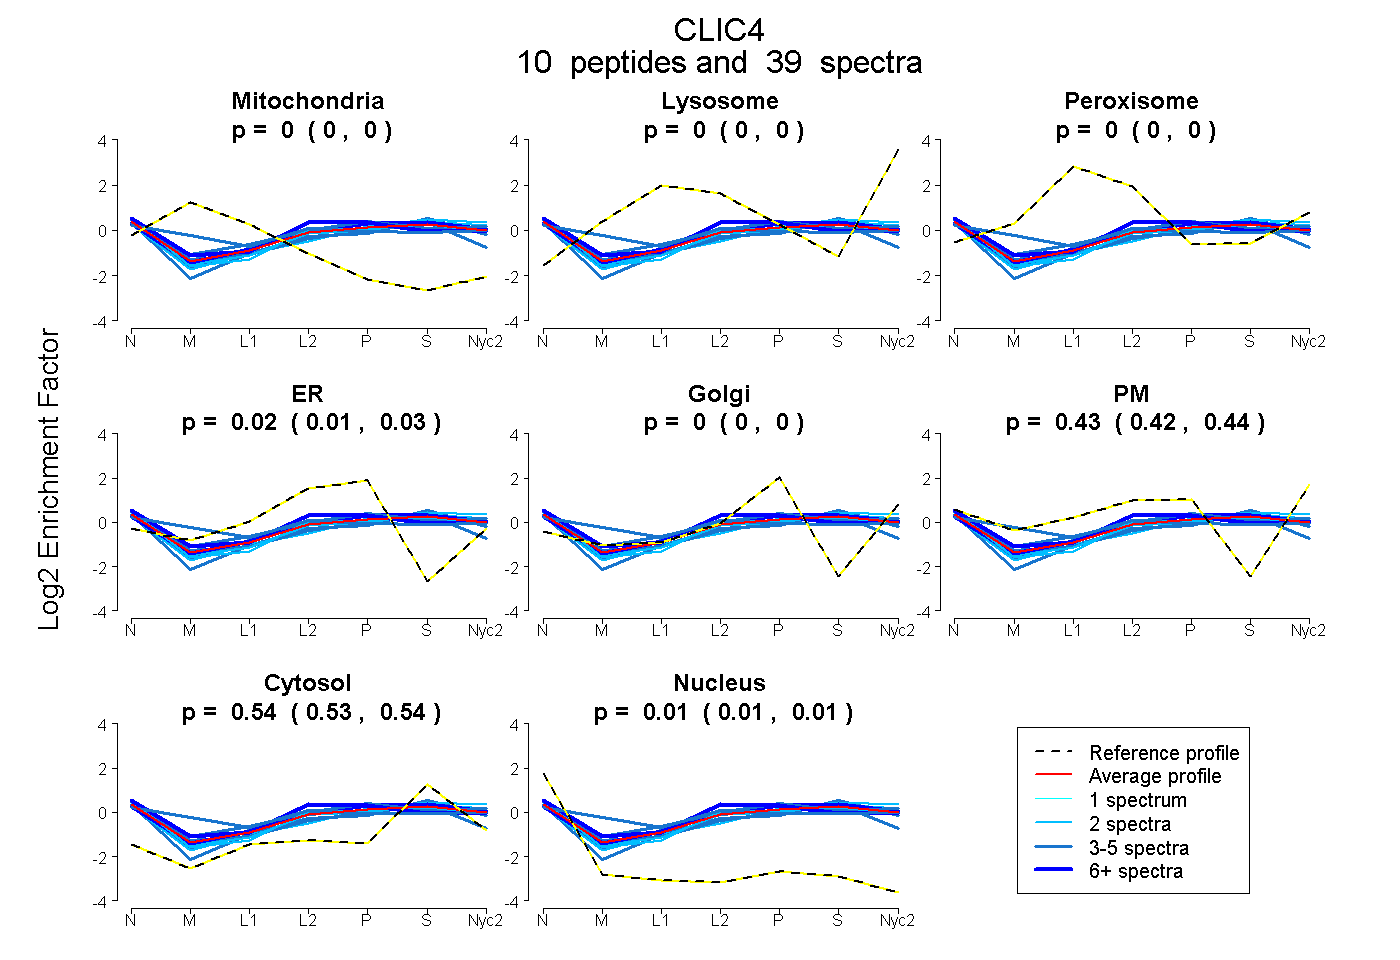
0.000 | 0.000
0.000 | 0.000
0.000 | 0.000
0.013 | 0.028
0.000 | 0.000
0.420 | 0.438
0.535 | 0.543
0.007 | 0.012
3peptides
spectra
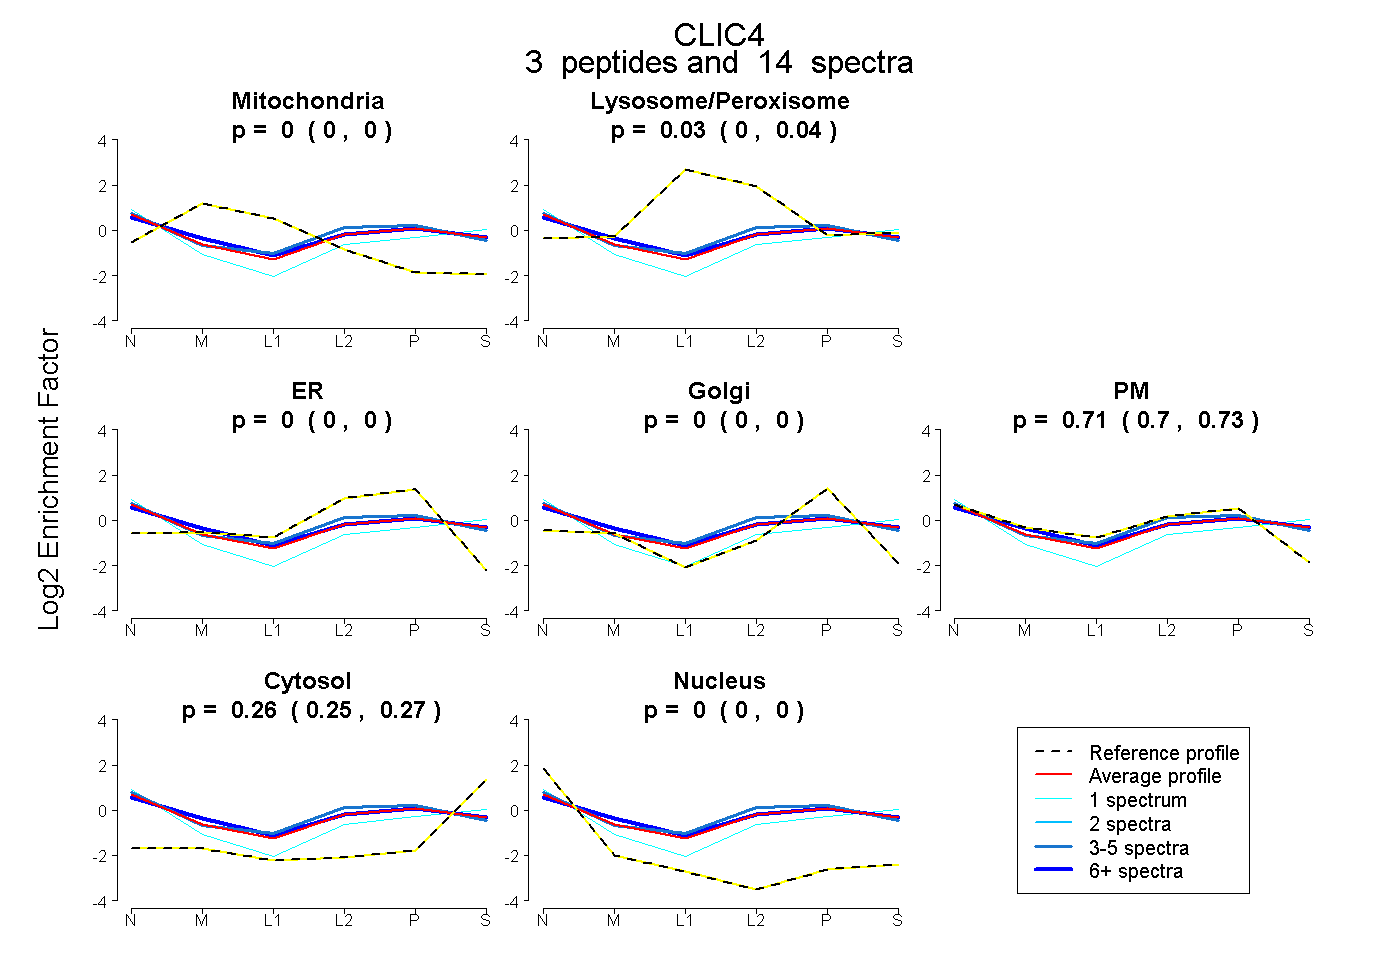
0.000 | 0.000
0.000 | 0.045
0.000 | 0.000
0.000 | 0.000
0.697 | 0.730
0.247 | 0.270
0.000 | 0.000
8peptides
spectra
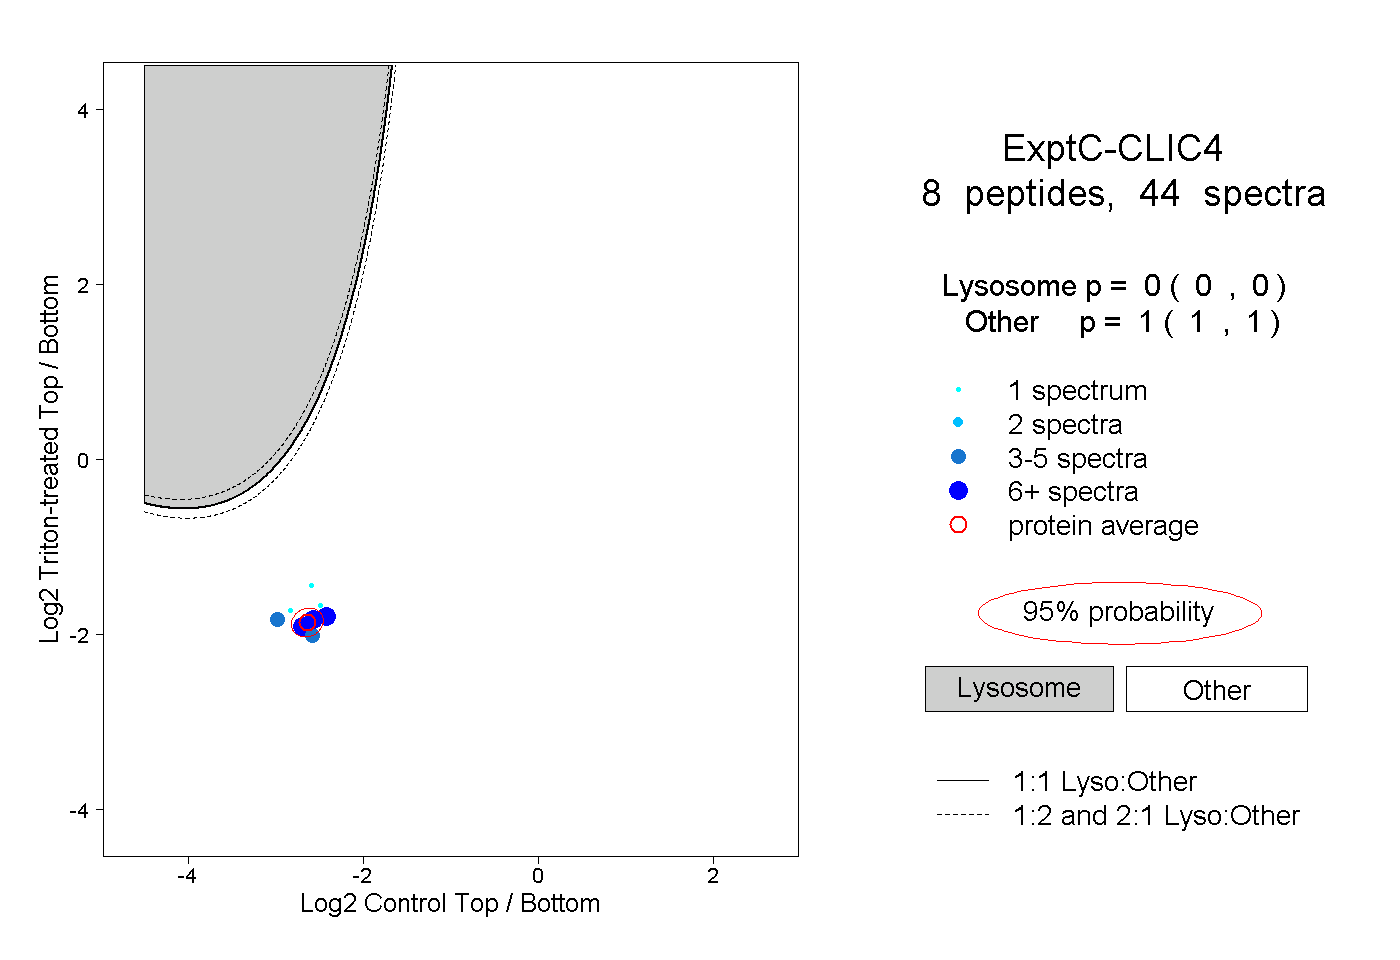
0.000 | 0.000
1.000 | 1.000
5peptides
spectra
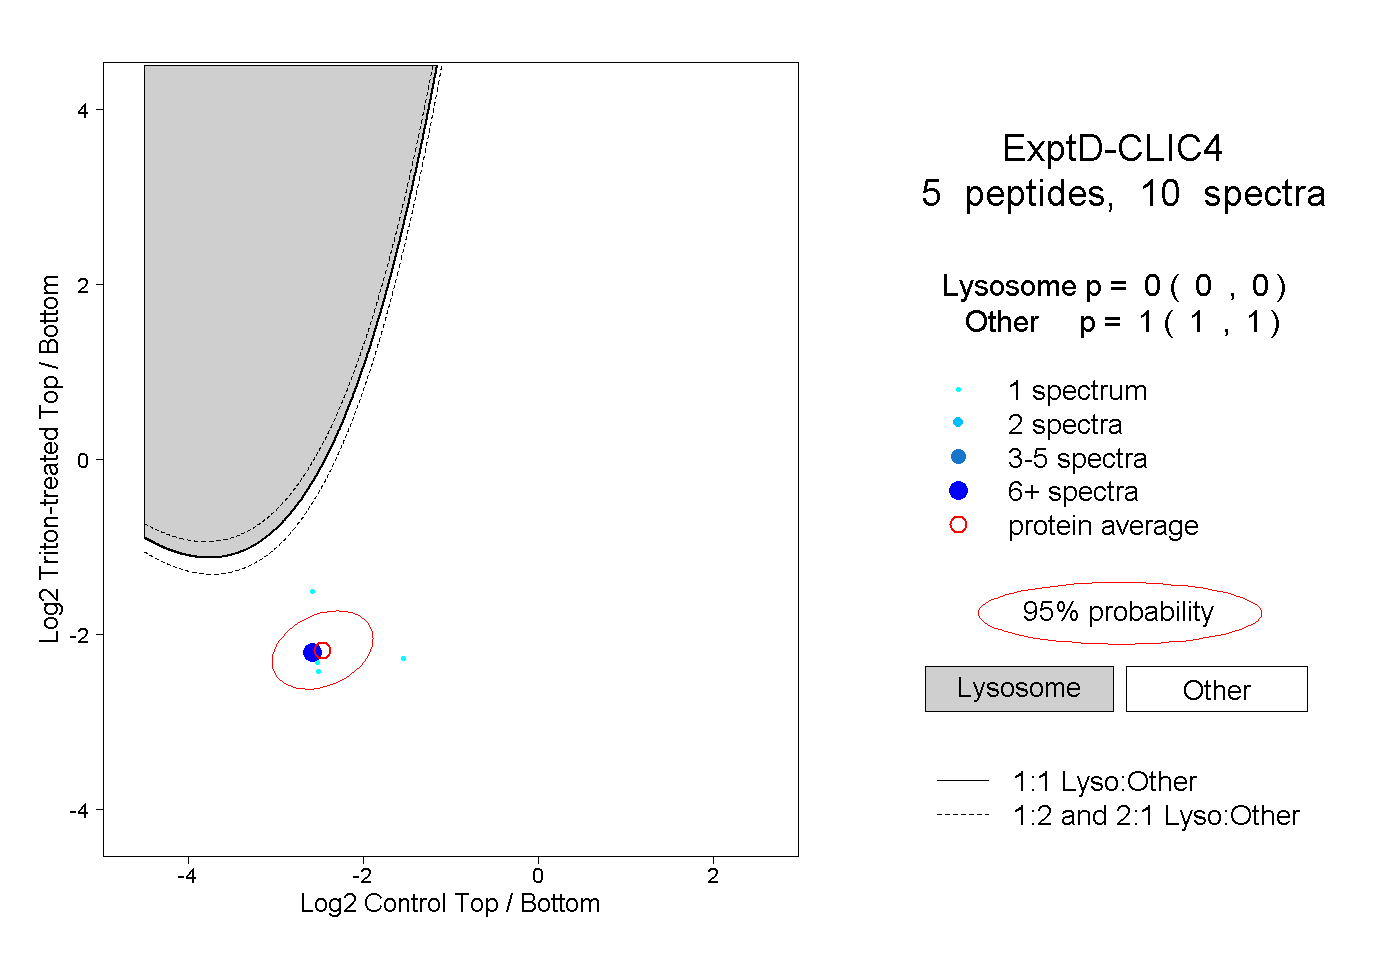
0.000 | 0.000
1.000 | 1.000