 10
10peptides
spectra
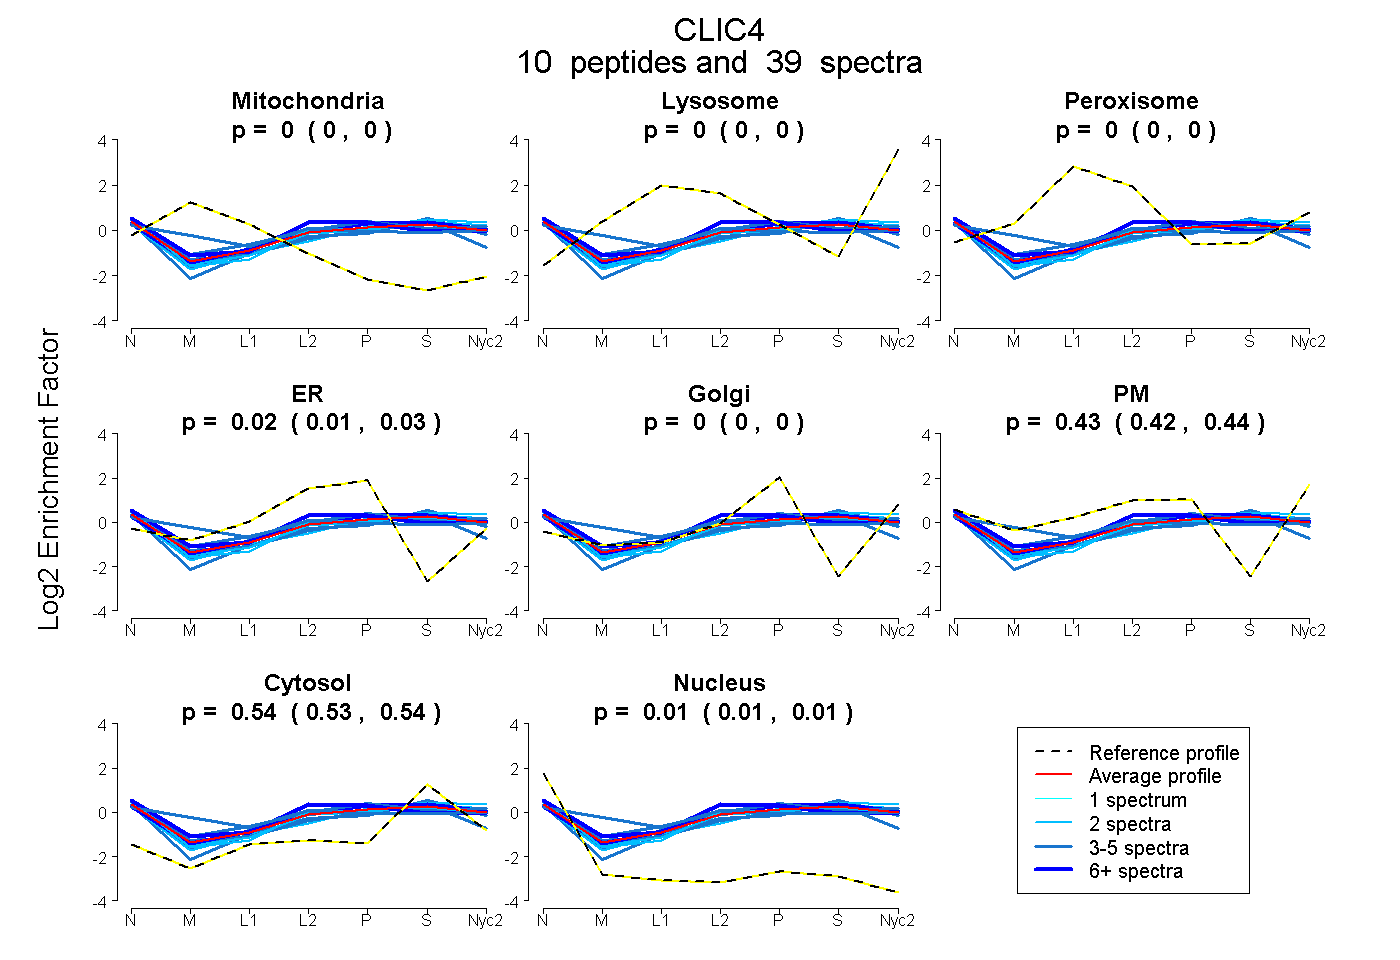
0.000 | 0.000
0.000 | 0.000
0.000 | 0.000
0.013 | 0.028
0.000 | 0.000
0.420 | 0.438
0.535 | 0.543
0.007 | 0.012
| Plot | Mito | Lyso | Perox | ER | Golgi | PM | Cytosol | Nucleus | |||||
| Expt A |
10 peptides |
39 spectra |
|
0.000 0.000 | 0.000 |
0.000 0.000 | 0.000 |
0.000 0.000 | 0.000 |
0.021 0.013 | 0.028 |
0.000 0.000 | 0.000 |
0.430 0.420 | 0.438 |
0.539 0.535 | 0.543 |
0.010 0.007 | 0.012 |
| 8 spectra, GMTGIWR | 0.000 | 0.000 | 0.000 | 0.051 | 0.000 | 0.406 | 0.543 | 0.000 | ||
| 3 spectra, YLTNAYSR | 0.113 | 0.000 | 0.067 | 0.000 | 0.000 | 0.418 | 0.402 | 0.000 | ||
| 9 spectra, NSRPEANEALER | 0.000 | 0.000 | 0.000 | 0.109 | 0.000 | 0.431 | 0.448 | 0.011 | ||
| 2 spectra, NFDIPK | 0.000 | 0.000 | 0.000 | 0.023 | 0.000 | 0.411 | 0.527 | 0.039 | ||
| 3 spectra, FLDGDEMTLADCNLLPK | 0.000 | 0.000 | 0.024 | 0.151 | 0.000 | 0.210 | 0.544 | 0.072 | ||
| 2 spectra, EVEIAYSDVAK | 0.000 | 0.000 | 0.000 | 0.000 | 0.005 | 0.404 | 0.591 | 0.000 | ||
| 3 spectra, DEFTNTCPSDK | 0.000 | 0.000 | 0.000 | 0.009 | 0.000 | 0.422 | 0.563 | 0.006 | ||
| 2 spectra, FSAYIK | 0.000 | 0.000 | 0.000 | 0.000 | 0.000 | 0.428 | 0.566 | 0.006 | ||
| 3 spectra, AGSDGESIGNCPFSQR | 0.000 | 0.000 | 0.000 | 0.000 | 0.000 | 0.345 | 0.627 | 0.028 | ||
| 4 spectra, HPESNTAGMDIFAK | 0.000 | 0.000 | 0.018 | 0.035 | 0.000 | 0.473 | 0.474 | 0.000 |
| Plot | Mito | Lyso or Perox | ER | Golgi | PM | Cytosol | Nucleus | ||||||
| Expt B |
3 peptides |
14 spectra |
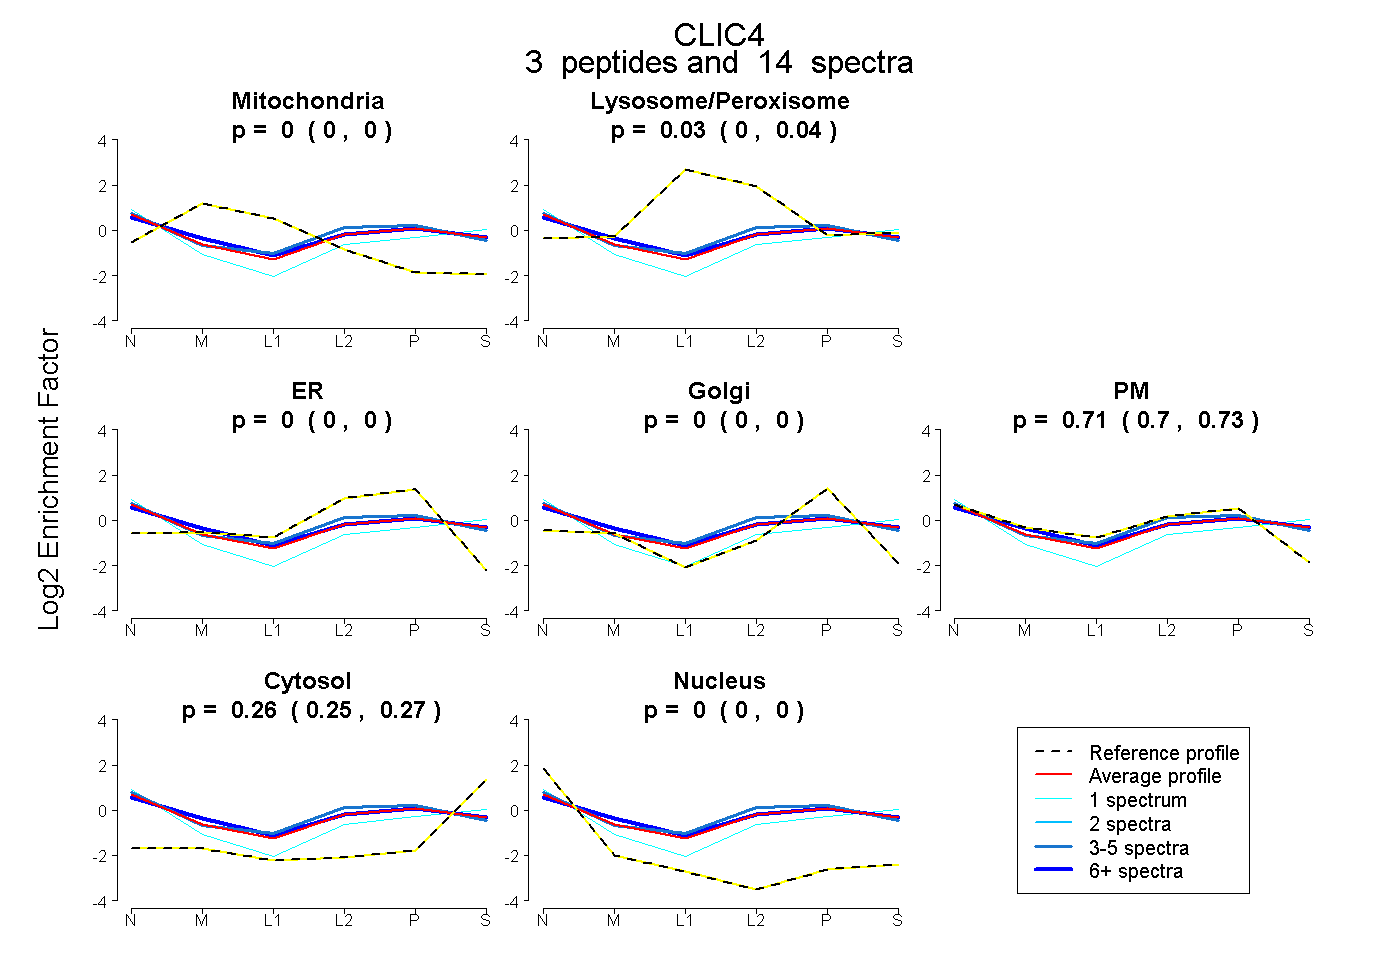 |
0.000 0.000 | 0.000 |
0.026 0.000 | 0.045 |
0.000 0.000 | 0.000 |
0.000 0.000 | 0.000 |
0.715 0.697 | 0.730 |
0.259 0.247 | 0.270 |
0.000 0.000 | 0.000 |
|||
| Plot | Lyso | Other | |||||||||||
| Expt C |
8 peptides |
44 spectra |
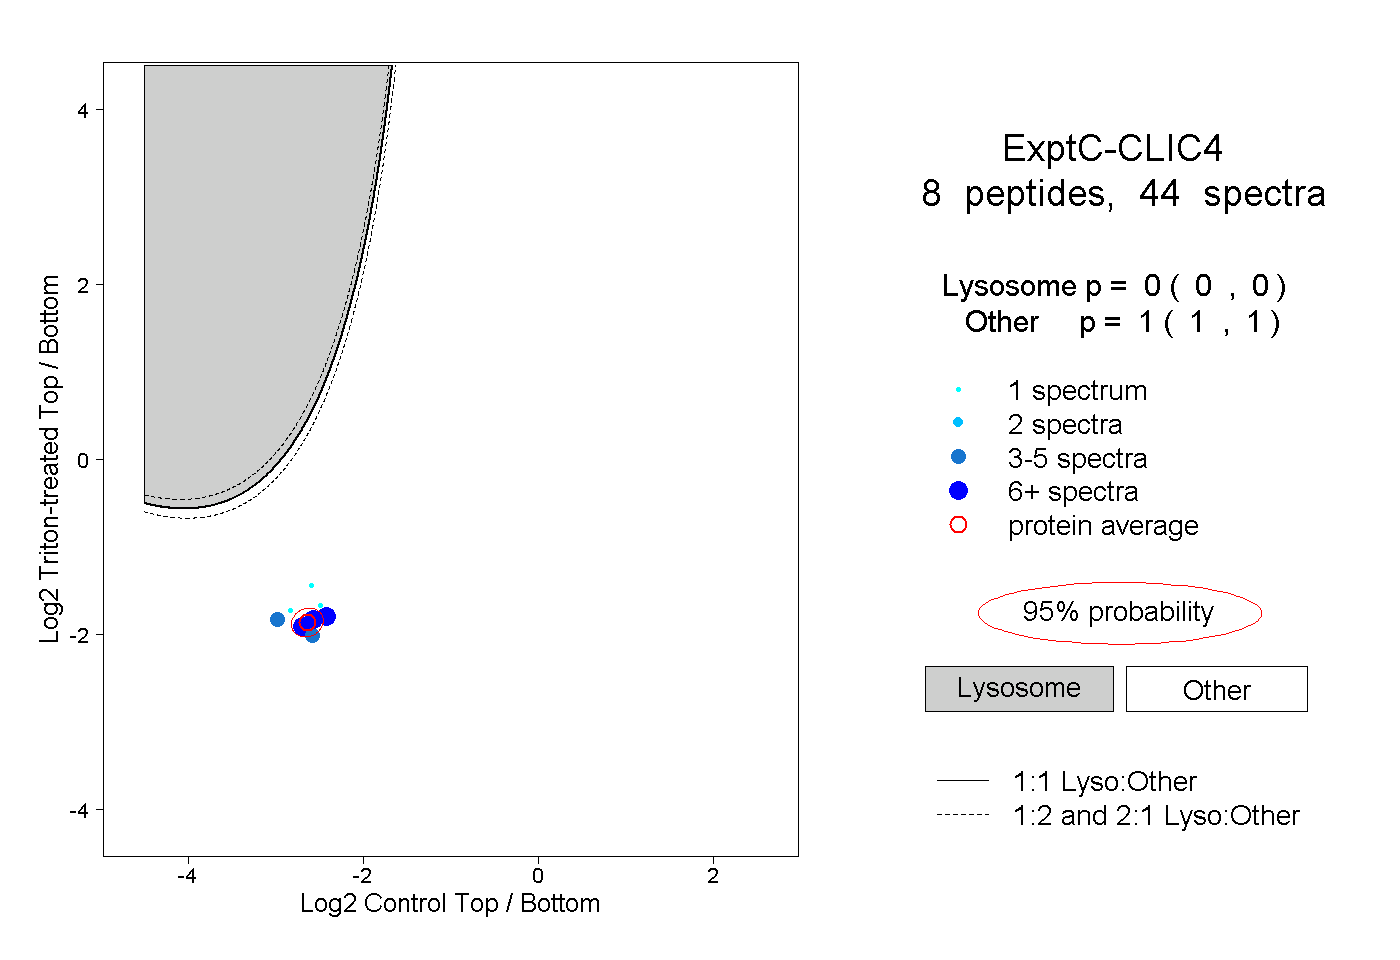 |
0.000 0.000 | 0.000 |
1.000 1.000 | 1.000 |
||||||||
| Plot | Lyso | Other | |||||||||||
| Expt D |
5 peptides |
10 spectra |
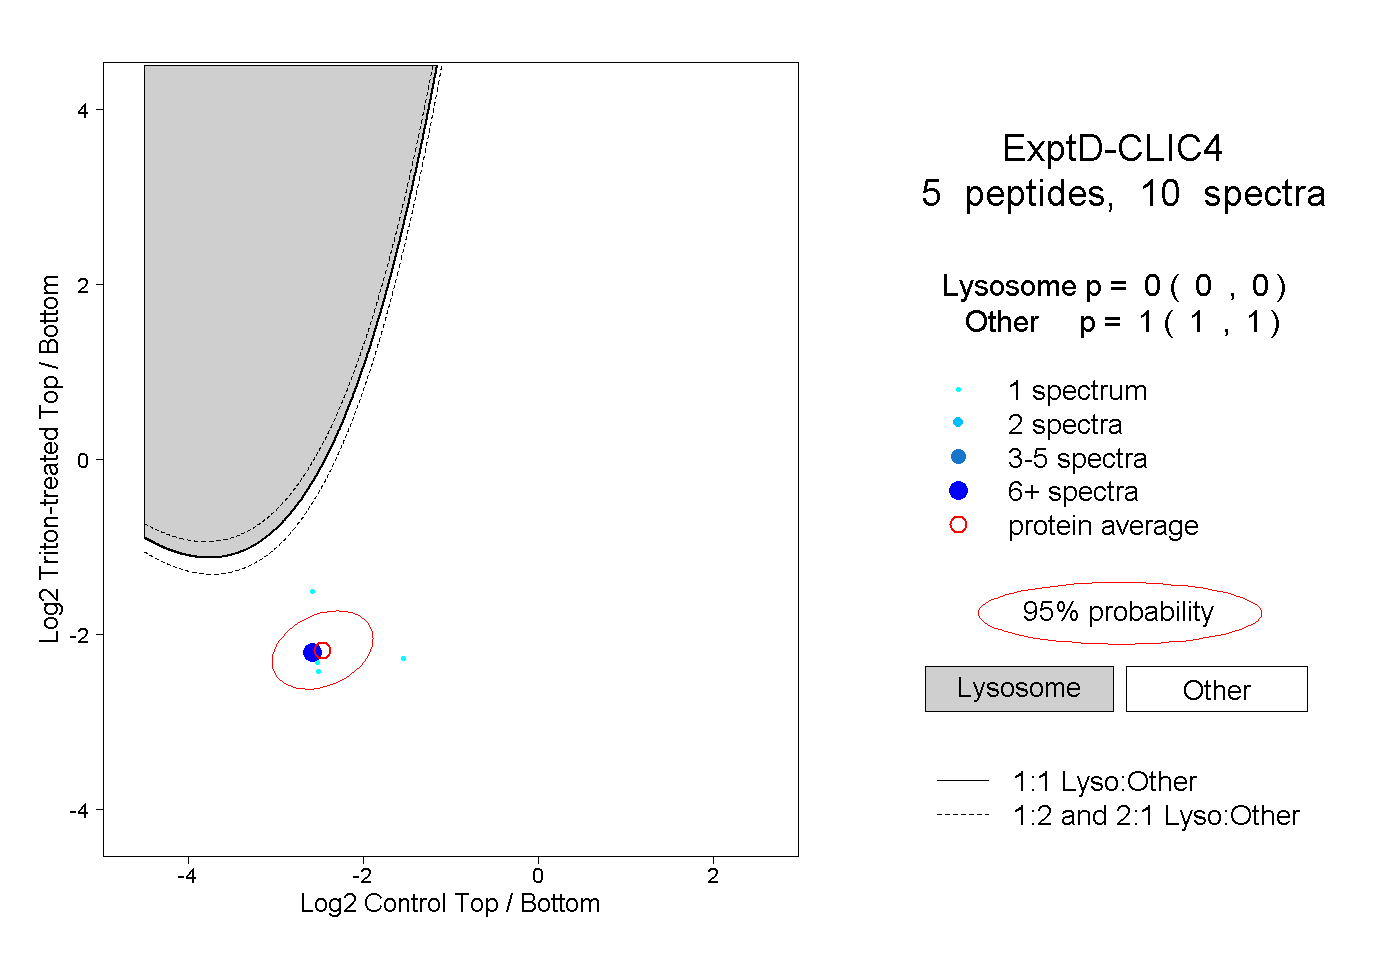 |
0.000 0.000 | 0.000 |
1.000 1.000 | 1.000 |