 12
12peptides
spectra

0.000 | 0.000
0.472 | 0.501
0.000 | 0.000
0.000 | 0.000
0.120 | 0.153
0.348 | 0.396
0.000 | 0.000
0.000 | 0.000
5peptides
spectra
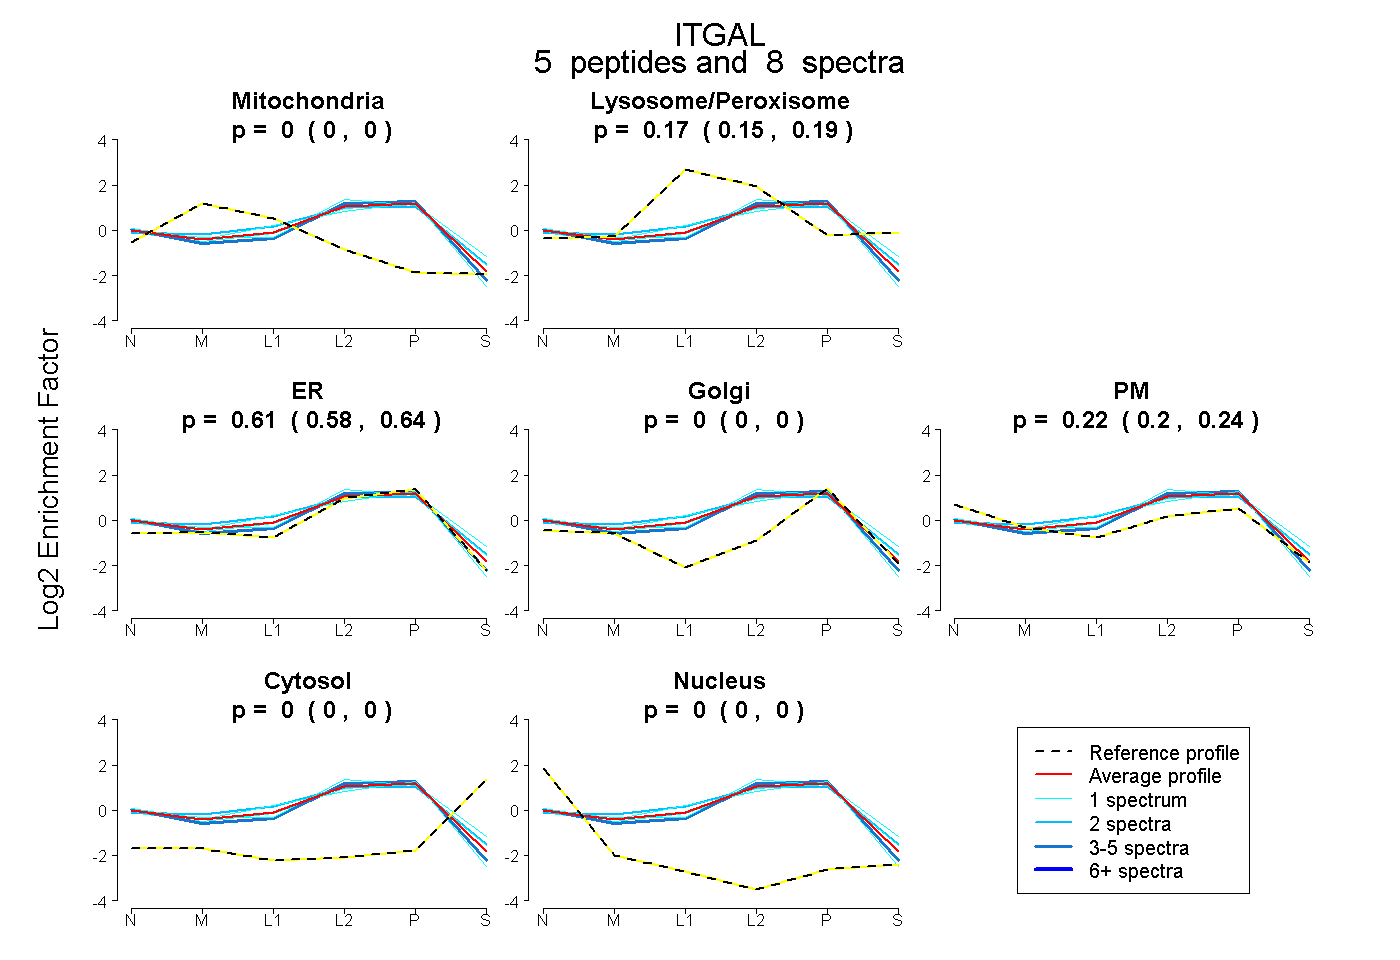
0.000 | 0.000
0.147 | 0.187
0.576 | 0.636
0.000 | 0.000
0.198 | 0.244
0.000 | 0.000
0.000 | 0.000
19peptides
spectra
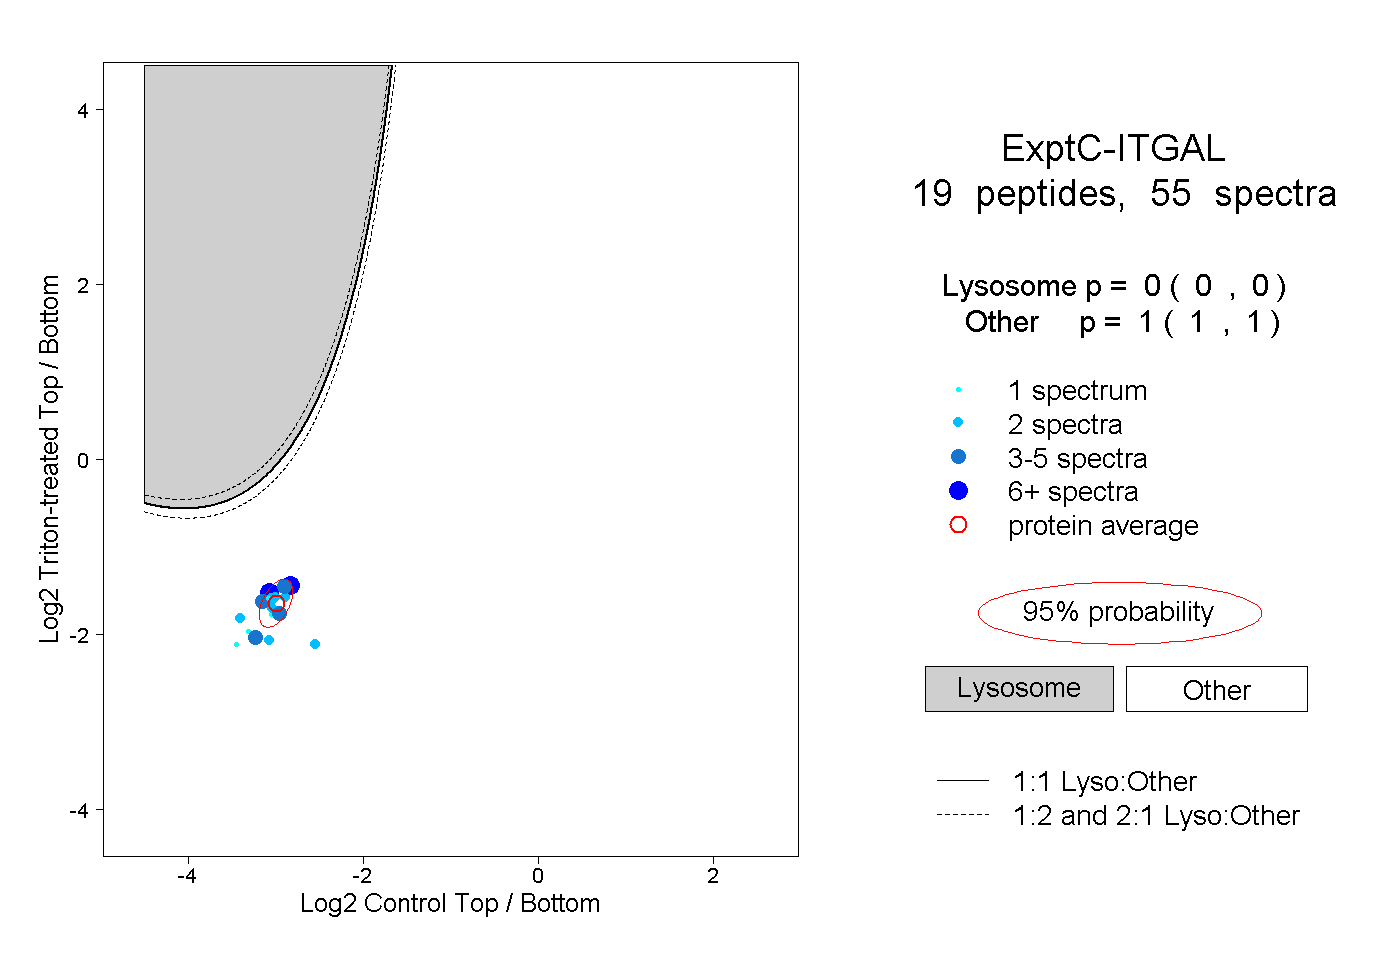
0.000 | 0.000
1.000 | 1.000
7peptides
spectra
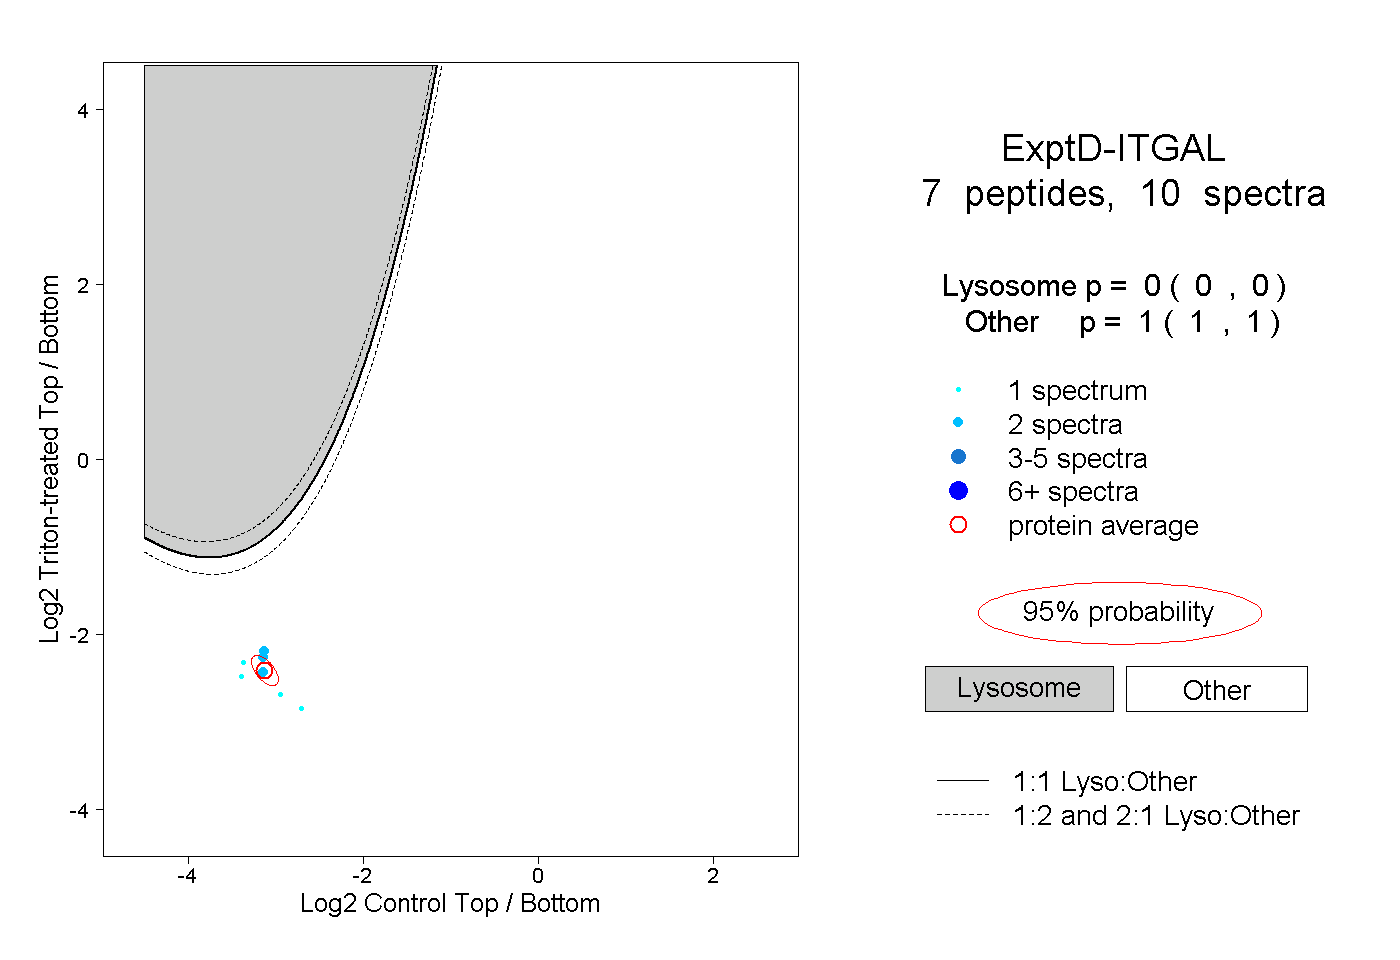
0.000 | 0.000
1.000 | 1.000