 12
12peptides
spectra

0.000 | 0.000
0.472 | 0.501
0.000 | 0.000
0.000 | 0.000
0.120 | 0.153
0.348 | 0.396
0.000 | 0.000
0.000 | 0.000
| Plot | Mito | Lyso | Perox | ER | Golgi | PM | Cytosol | Nucleus | |||||
| Expt A |
12 peptides |
31 spectra |
|
0.000 0.000 | 0.000 |
0.488 0.472 | 0.501 |
0.000 0.000 | 0.000 |
0.000 0.000 | 0.000 |
0.138 0.120 | 0.153 |
0.375 0.348 | 0.396 |
0.000 0.000 | 0.000 |
0.000 0.000 | 0.000 |
| 1 spectrum, DMGCLEPLR | 0.000 | 0.683 | 0.000 | 0.070 | 0.081 | 0.159 | 0.007 | 0.000 | ||
| 2 spectra, HAQSFLTQAGR | 0.000 | 0.385 | 0.000 | 0.000 | 0.012 | 0.424 | 0.179 | 0.000 | ||
| 3 spectra, GLFPGGSR | 0.000 | 0.501 | 0.000 | 0.000 | 0.101 | 0.398 | 0.000 | 0.000 | ||
| 2 spectra, TEFTFLDYIK | 0.000 | 0.482 | 0.000 | 0.000 | 0.063 | 0.455 | 0.000 | 0.000 | ||
| 2 spectra, ILDTFEK | 0.000 | 0.296 | 0.000 | 0.000 | 0.010 | 0.694 | 0.000 | 0.000 | ||
| 2 spectra, IYAIEGTSK | 0.000 | 0.459 | 0.000 | 0.000 | 0.086 | 0.134 | 0.321 | 0.000 | ||
| 2 spectra, IPGTQVSPGVR | 0.000 | 0.550 | 0.000 | 0.000 | 0.032 | 0.418 | 0.000 | 0.000 | ||
| 1 spectrum, GHAVVGAVGAK | 0.000 | 0.124 | 0.282 | 0.000 | 0.093 | 0.392 | 0.109 | 0.000 | ||
| 1 spectrum, NLGEDAYWVR | 0.000 | 0.390 | 0.000 | 0.002 | 0.000 | 0.608 | 0.000 | 0.000 | ||
| 2 spectra, LDLDFPR | 0.000 | 0.613 | 0.000 | 0.000 | 0.188 | 0.200 | 0.000 | 0.000 | ||
| 1 spectrum, CPIVFR | 0.000 | 0.366 | 0.000 | 0.249 | 0.248 | 0.137 | 0.000 | 0.000 | ||
| 12 spectra, SSRPLLAAGAPR | 0.000 | 0.598 | 0.000 | 0.000 | 0.000 | 0.402 | 0.000 | 0.000 |
| Plot | Mito | Lyso or Perox | ER | Golgi | PM | Cytosol | Nucleus | ||||||
| Expt B |
5 peptides |
8 spectra |
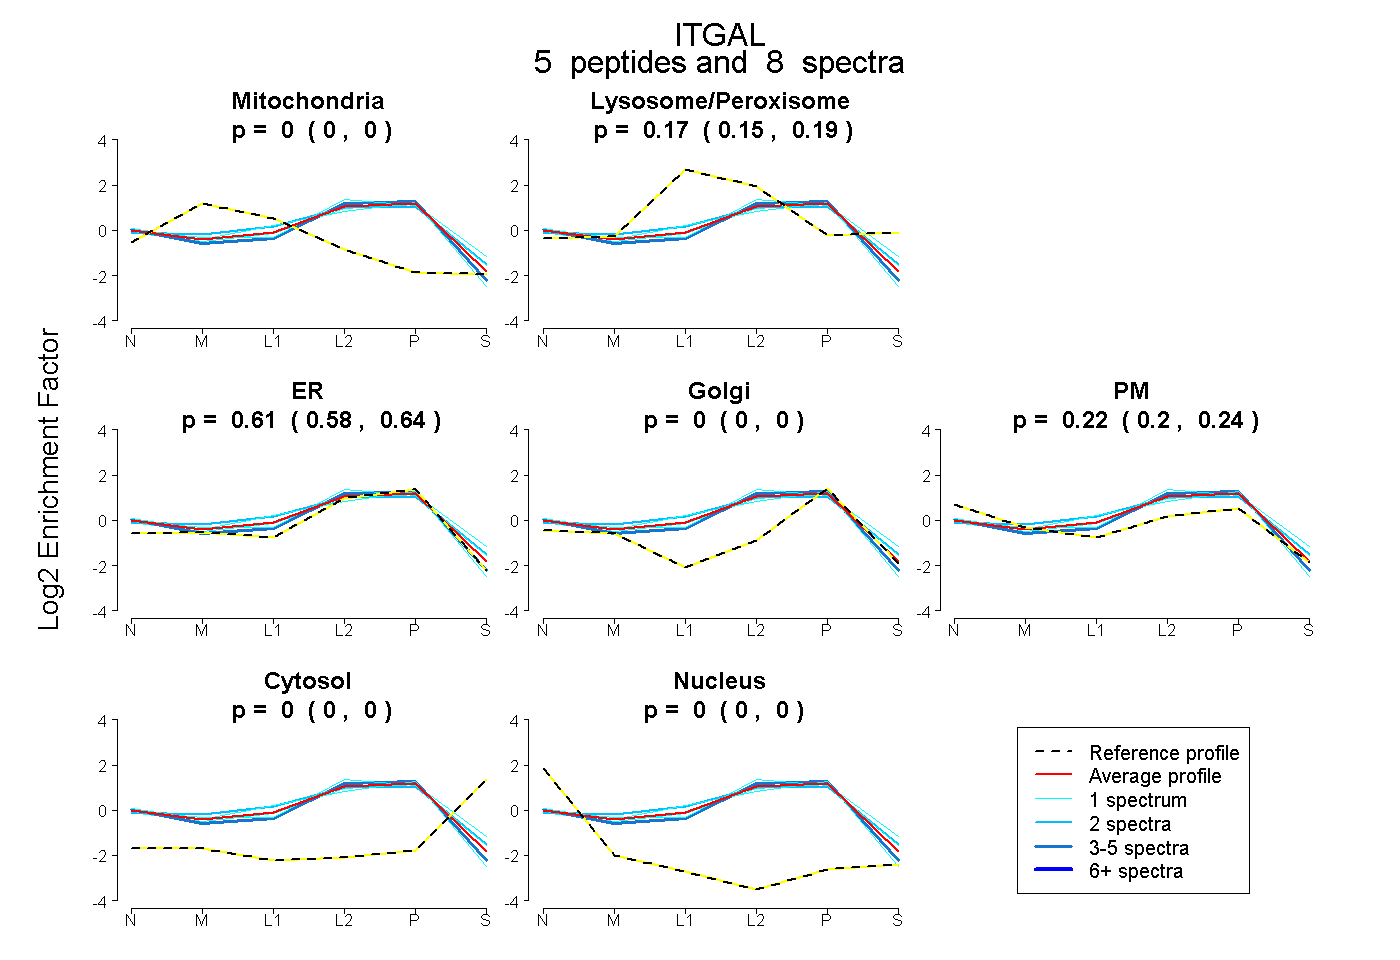 |
0.000 0.000 | 0.000 |
0.168 0.147 | 0.187 |
0.609 0.576 | 0.636 |
0.000 0.000 | 0.000 |
0.222 0.198 | 0.244 |
0.000 0.000 | 0.000 |
0.000 0.000 | 0.000 |
|||
| Plot | Lyso | Other | |||||||||||
| Expt C |
19 peptides |
55 spectra |
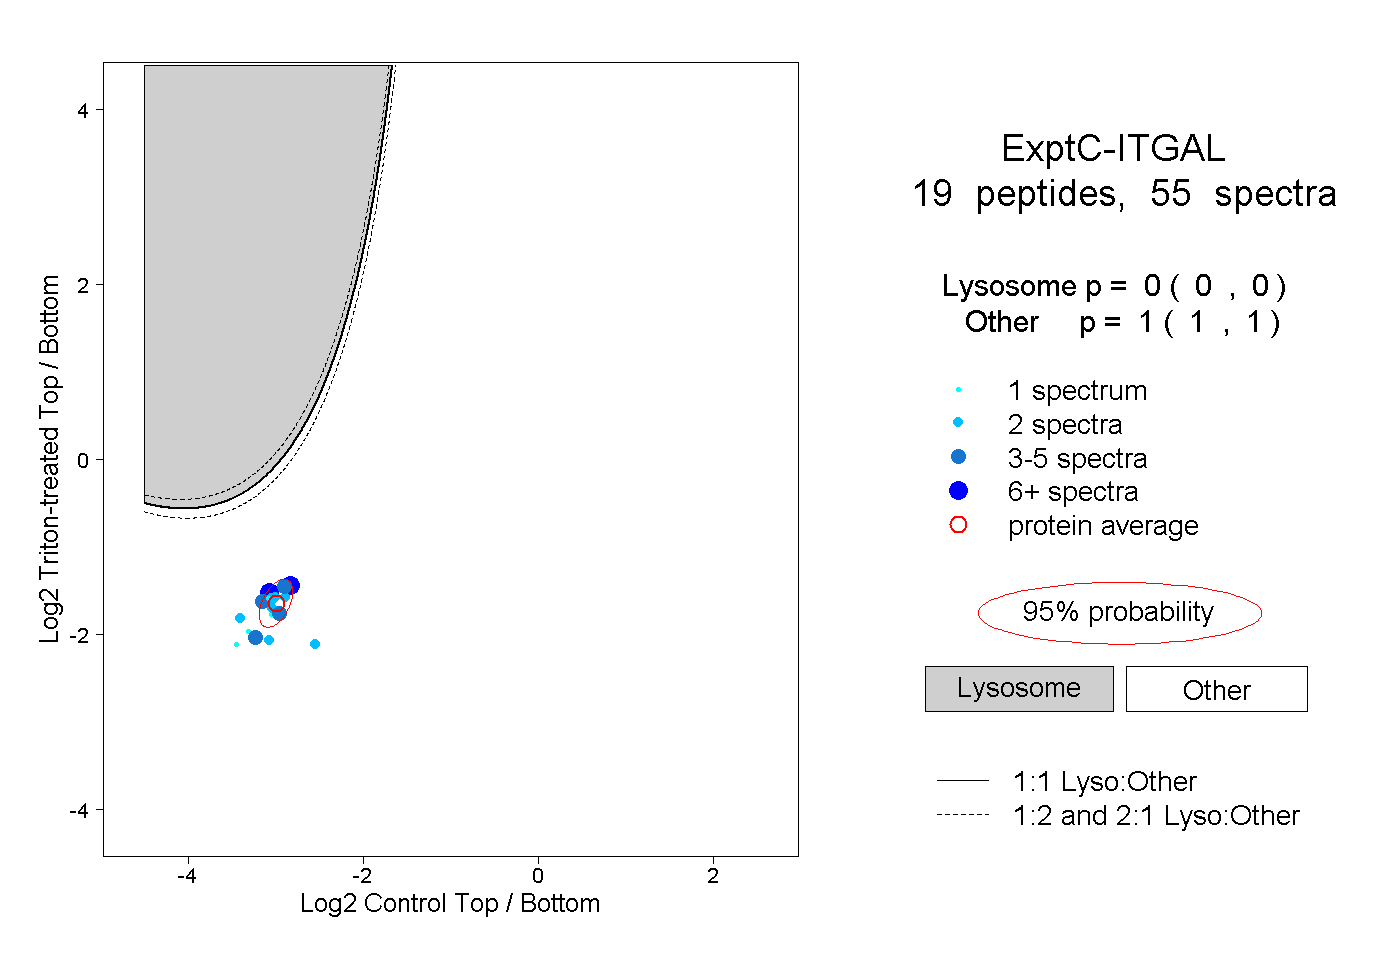 |
0.000 0.000 | 0.000 |
1.000 1.000 | 1.000 |
||||||||
| Plot | Lyso | Other | |||||||||||
| Expt D |
7 peptides |
10 spectra |
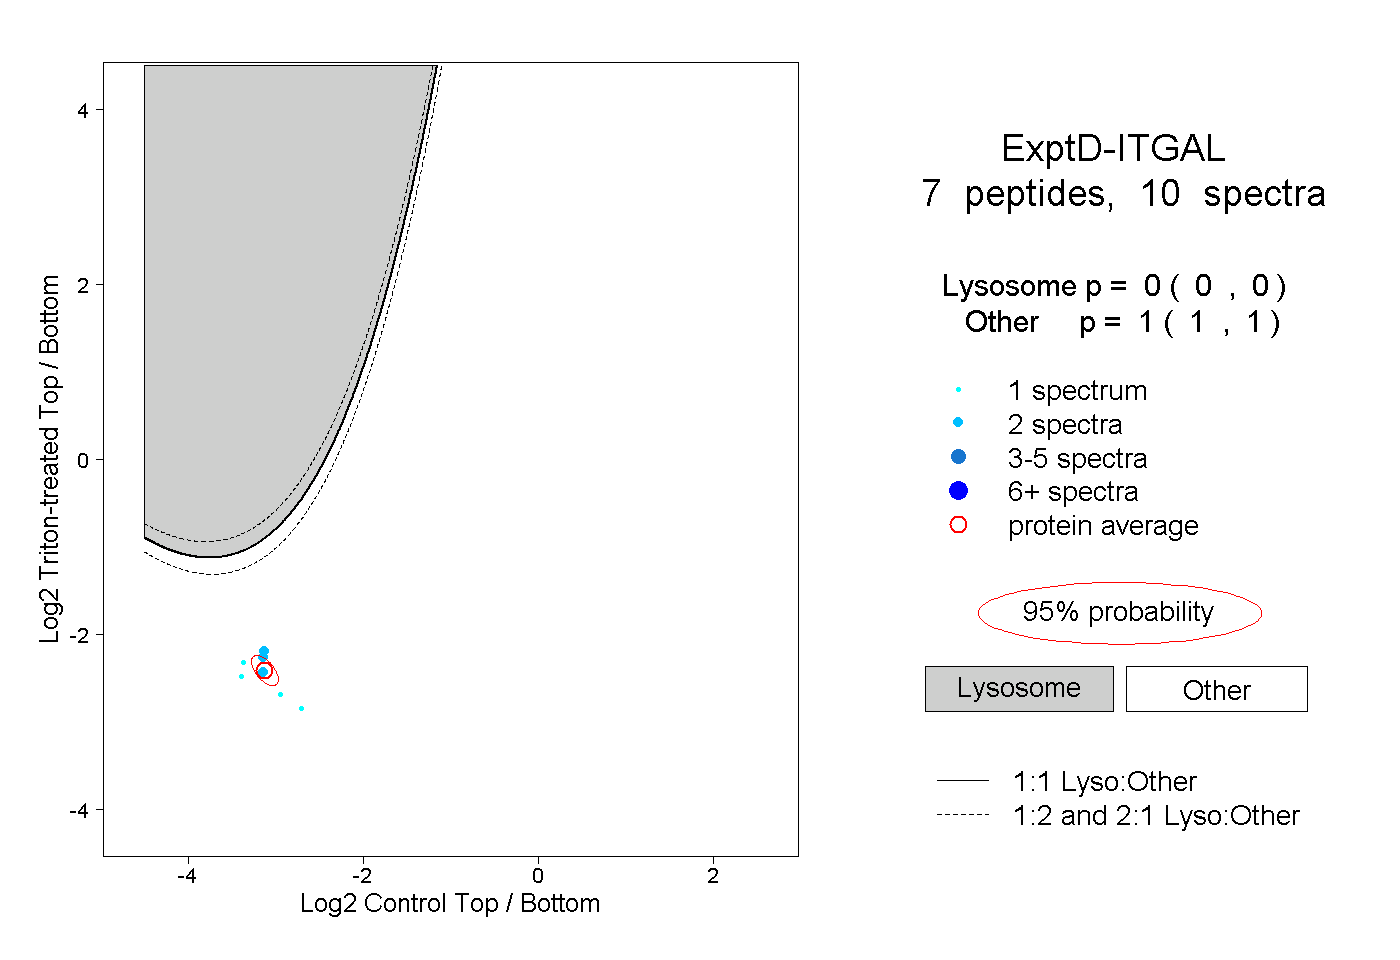 |
0.000 0.000 | 0.000 |
1.000 1.000 | 1.000 |