 6
6peptides
spectra
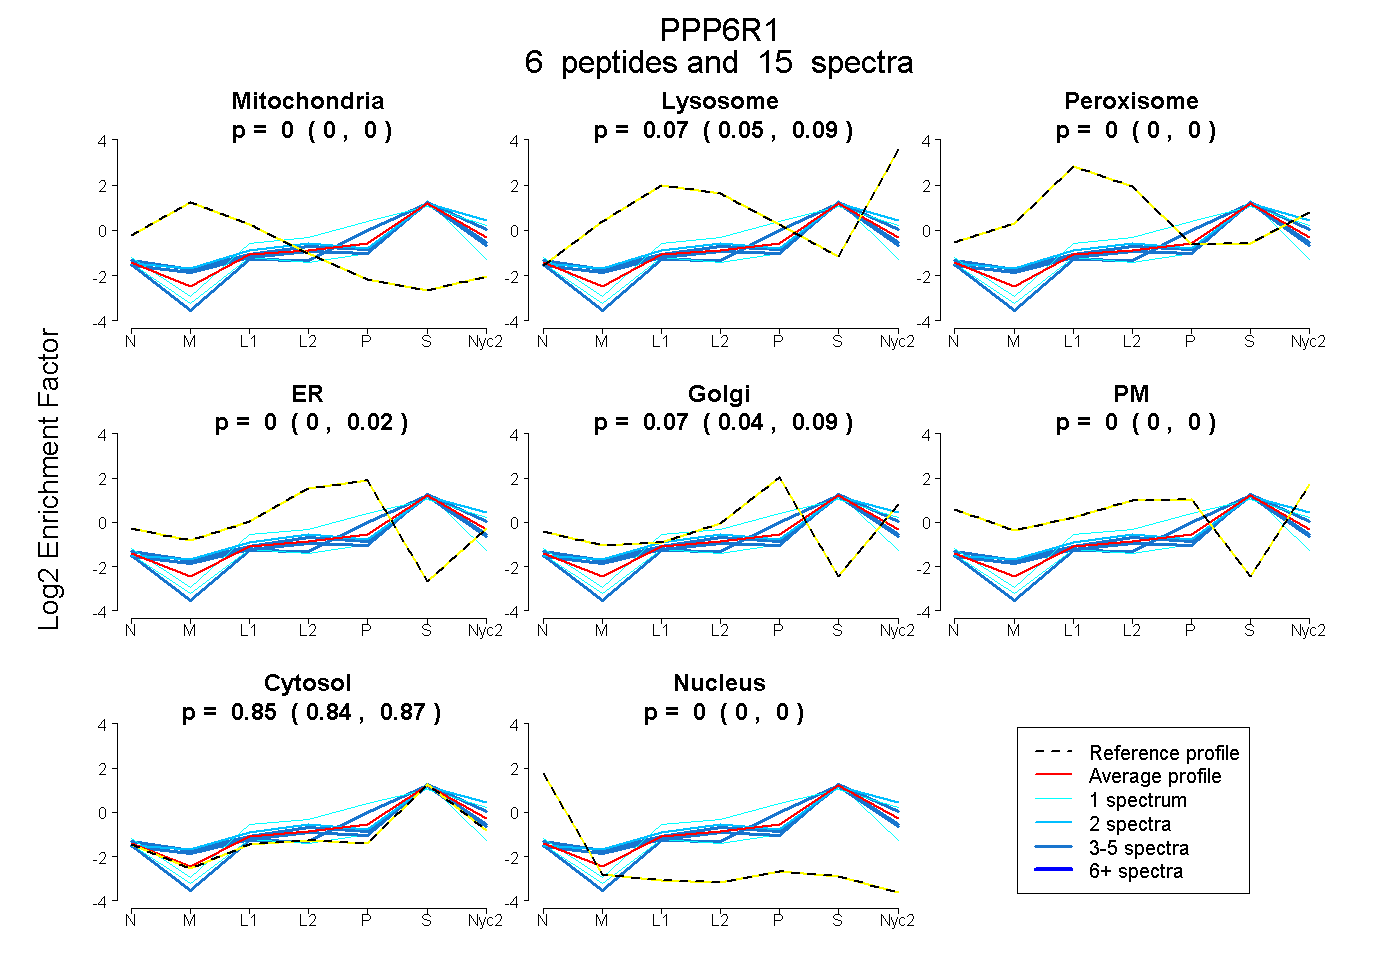
0.000 | 0.000
0.054 | 0.092
0.000 | 0.000
0.000 | 0.024
0.039 | 0.086
0.000 | 0.000
0.837 | 0.867
0.000 | 0.000
4peptides
spectra
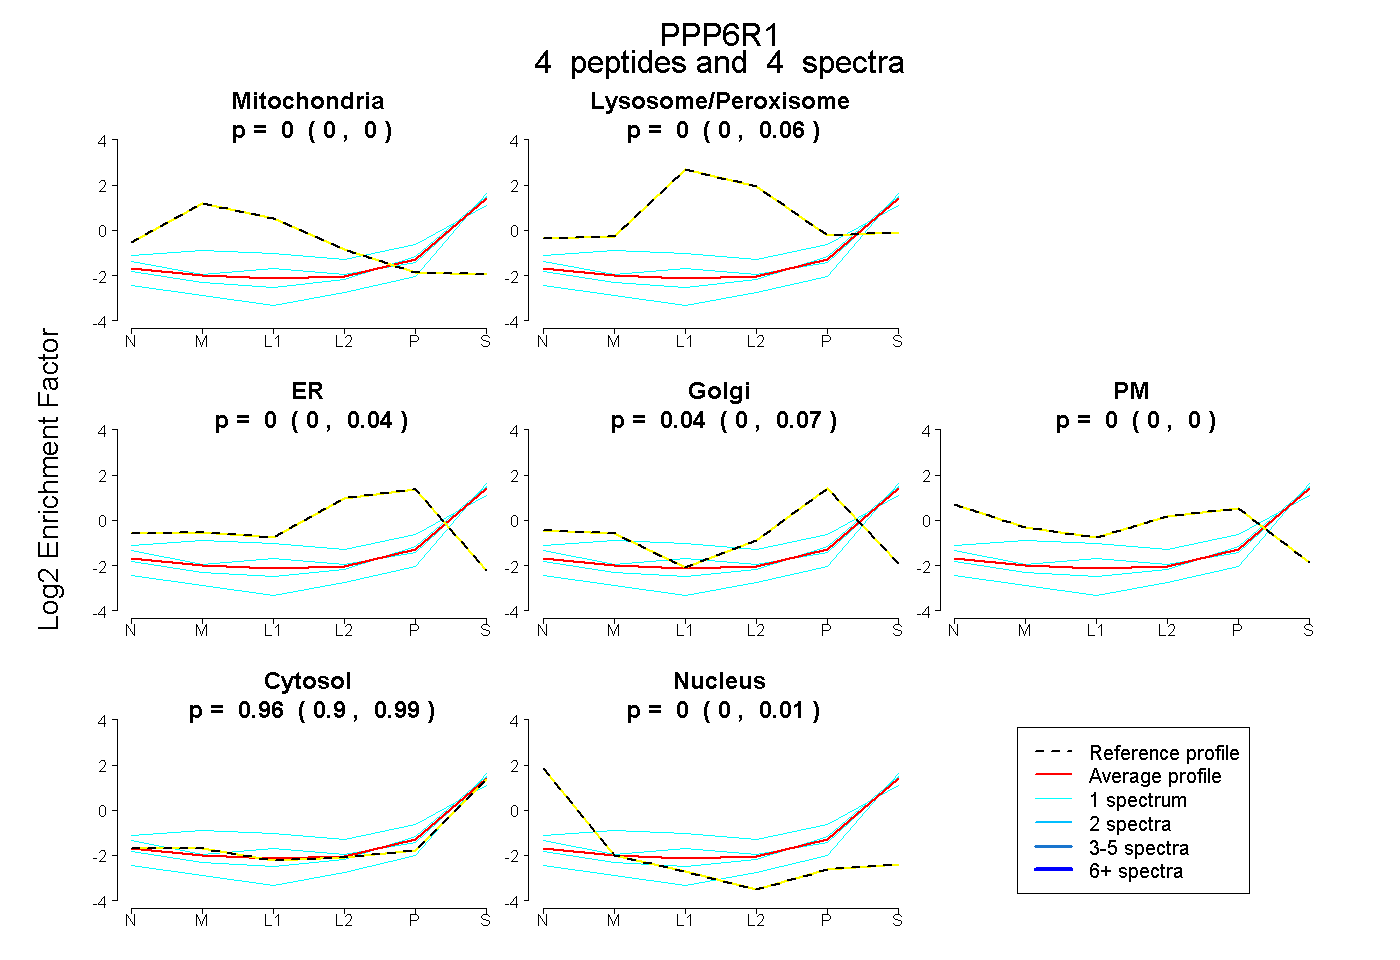
0.000 | 0.000
0.000 | 0.059
0.000 | 0.036
0.000 | 0.071
0.000 | 0.000
0.905 | 0.991
0.000 | 0.009
2peptides
spectra
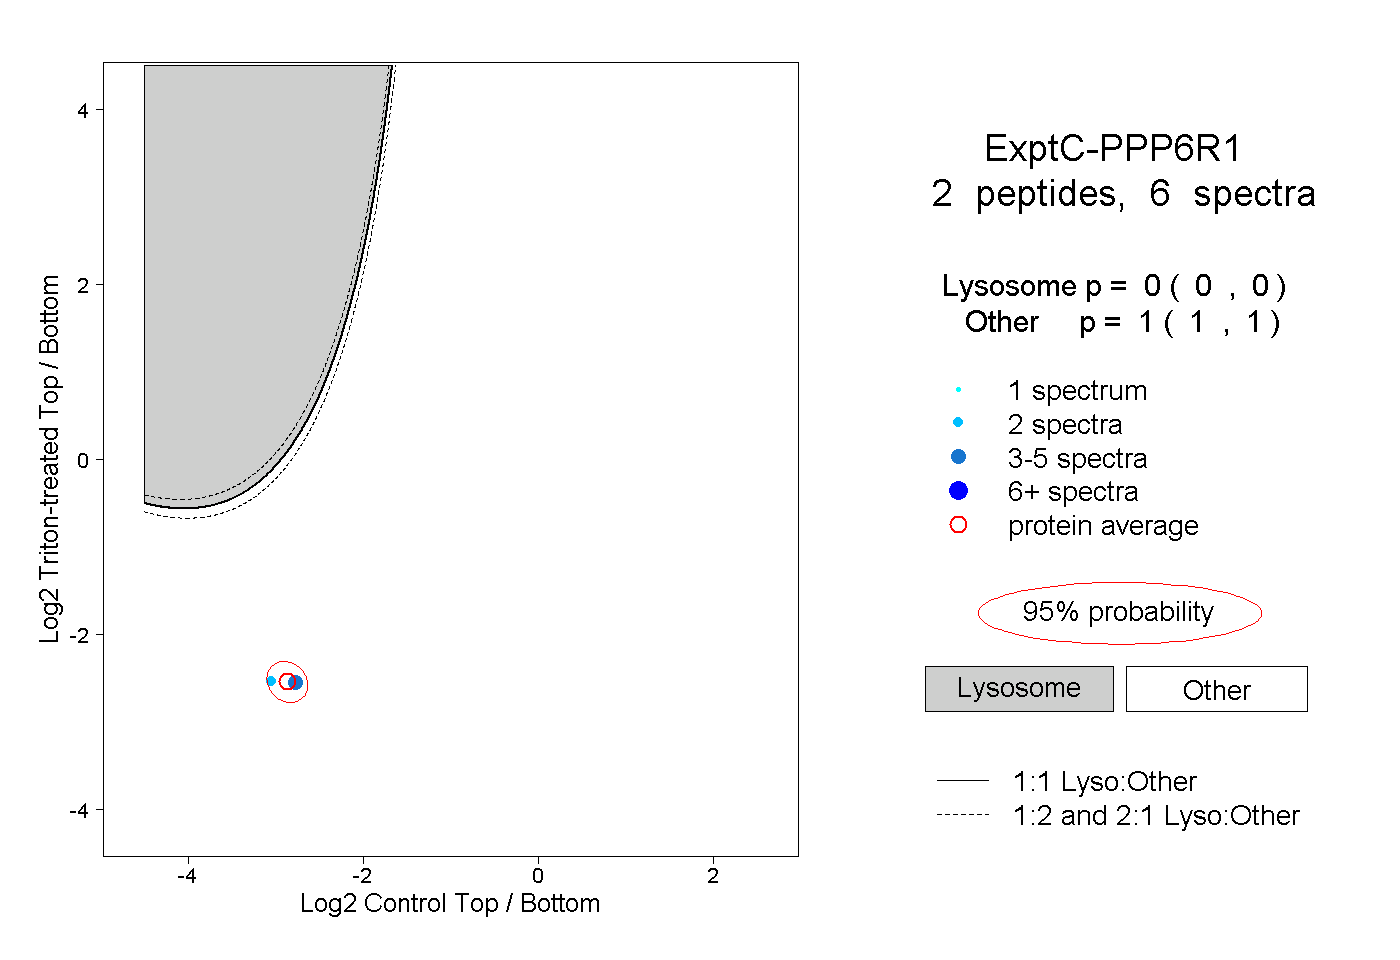
0.000 | 0.000
1.000 | 1.000
1peptide
spectra
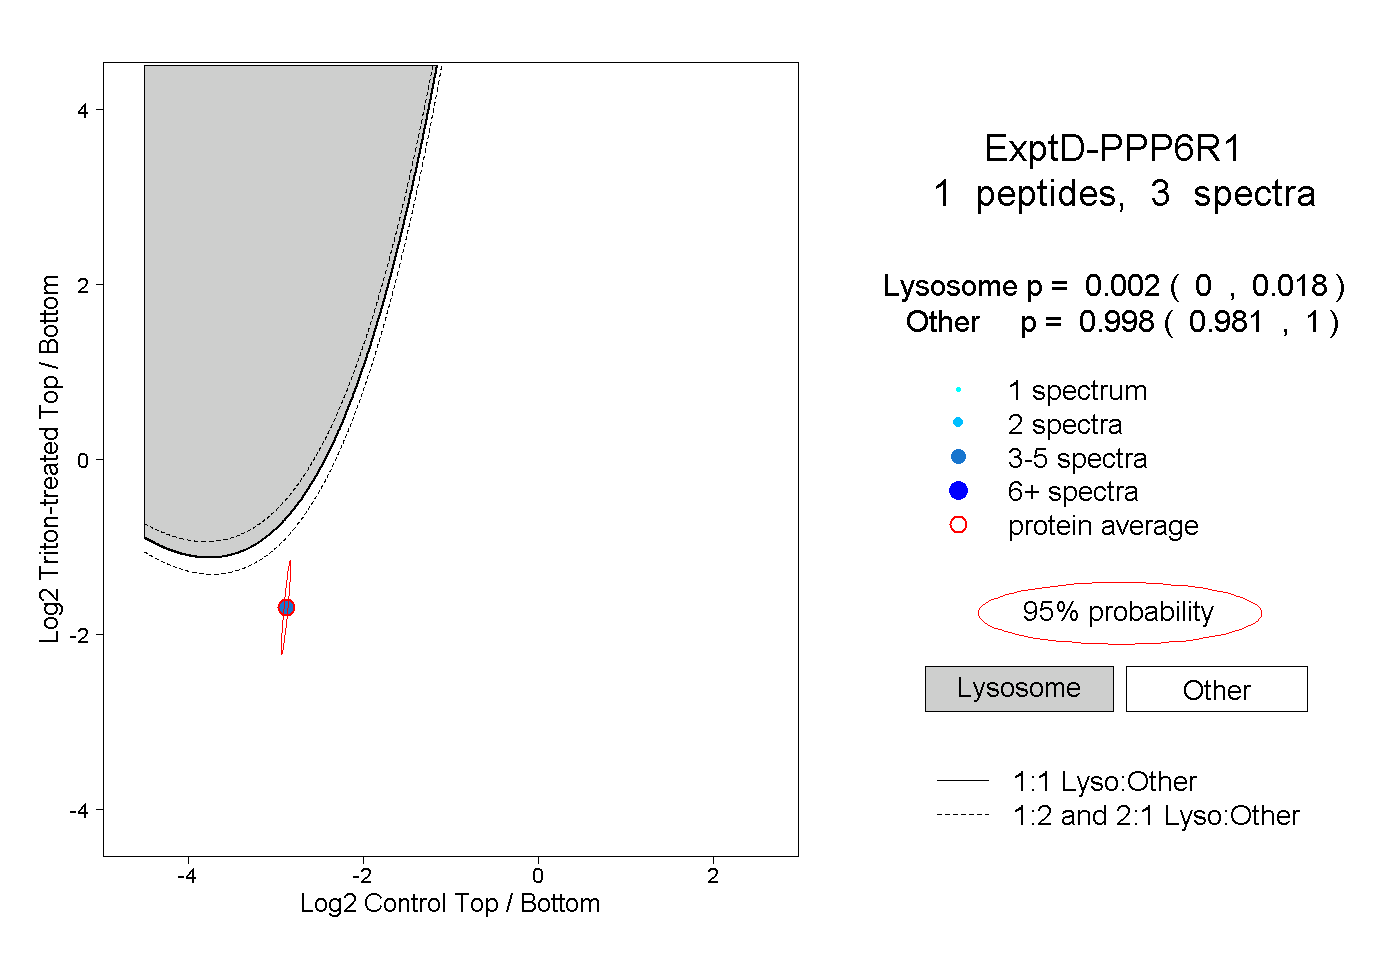
0.000 | 0.018
0.981 | 1.000