PPP6R1
[ENSRNOP00000024400]
Main page
| | | Plot |
Mito |
Lyso |
|
Perox |
ER |
Golgi |
PM |
Cytosol |
Nucleus |
|
| Expt A |
 6
6
peptides |
15
spectra |
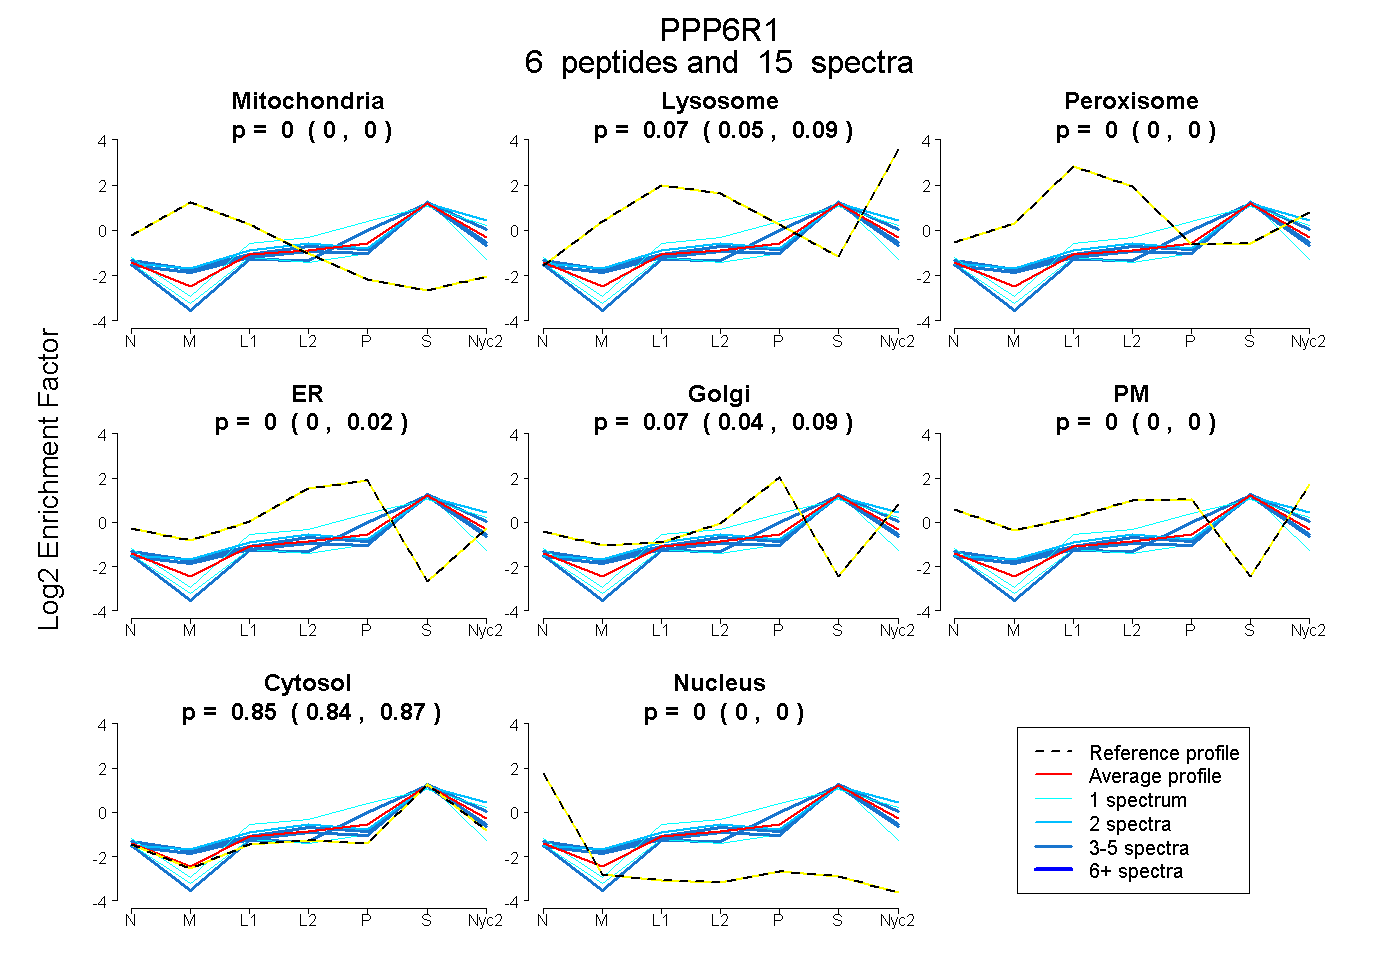 |
0.000
0.000 | 0.000 |
0.075
0.054 | 0.092 |
|
0.000
0.000 | 0.000 |
0.000
0.000 | 0.024 |
0.071
0.039 | 0.086 |
0.000
0.000 | 0.000 |
0.854
0.837 | 0.867 |
0.000
0.000 | 0.000 |
|
| | | Plot |
Mito |
|
Lyso or Perox |
|
ER |
Golgi |
PM |
Cytosol |
Nucleus |
|
| Expt B |
4
peptides |
4
spectra |
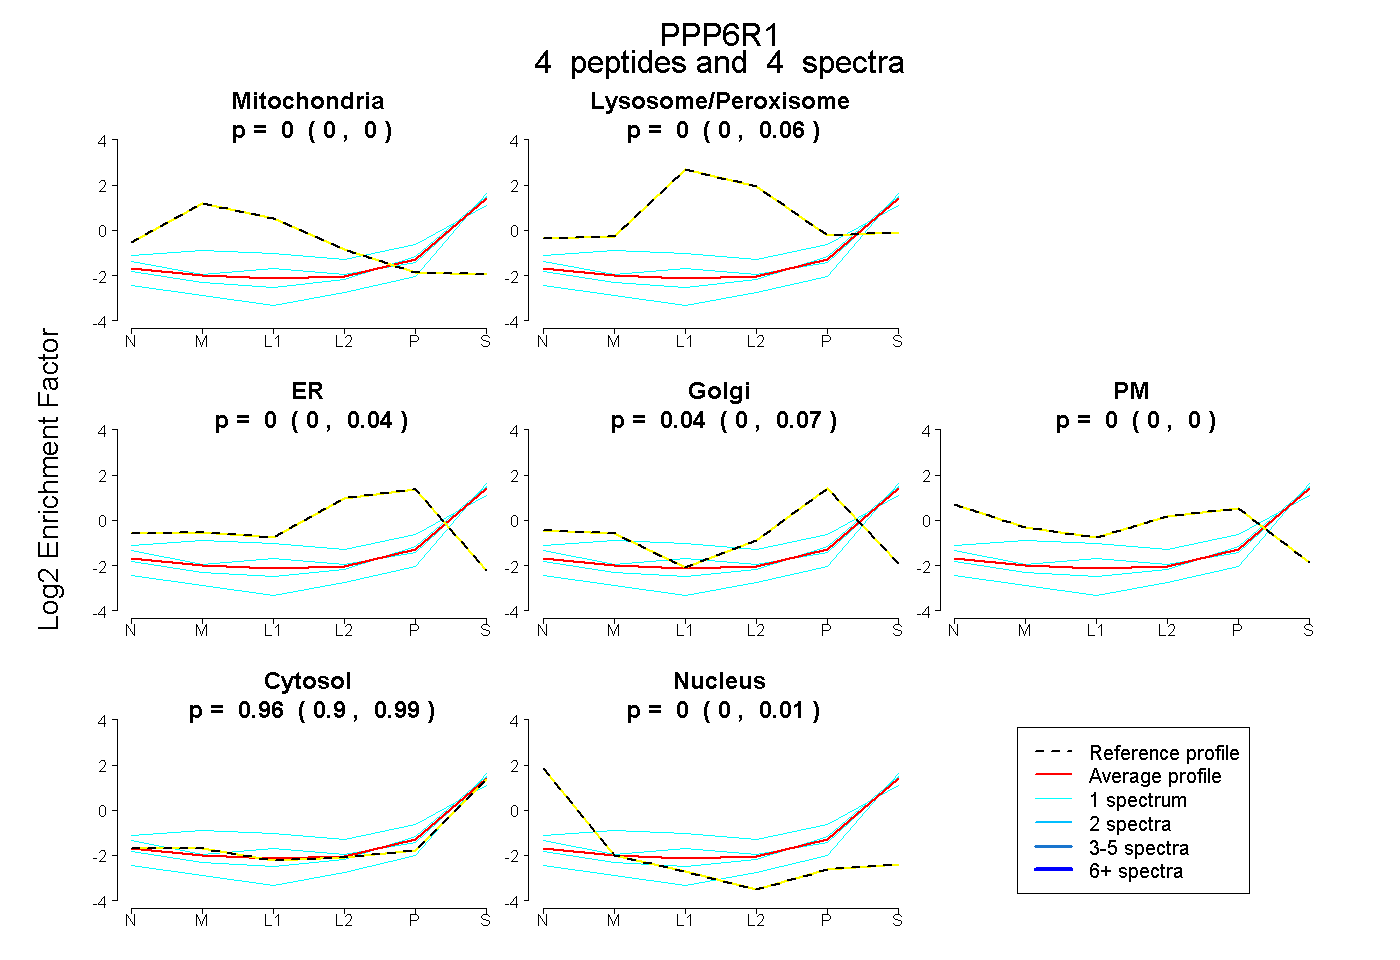 |
0.000
0.000 | 0.000 |
|
0.001
0.000 | 0.059 |
|
0.000
0.000 | 0.036 |
0.041
0.000 | 0.071 |
0.000
0.000 | 0.000 |
0.958
0.905 | 0.991 |
0.000
0.000 | 0.009 |
|
| 1 spectrum, LLTCVERPQLR |
0.000 |
|
0.072 |
|
0.000 |
0.000 |
0.000 |
0.917 |
0.011 |
|
| 1 spectrum, ELPEEQQQR |
0.000 |
|
0.000 |
|
0.000 |
0.026 |
0.000 |
0.974 |
0.000 |
|
| 1 spectrum, HLLQHCR |
0.000 |
|
0.224 |
|
0.000 |
0.122 |
0.000 |
0.655 |
0.000 |
|
| 1 spectrum, VMGILINR |
0.000 |
|
0.000 |
|
0.000 |
0.000 |
0.000 |
1.000 |
0.000 |
|
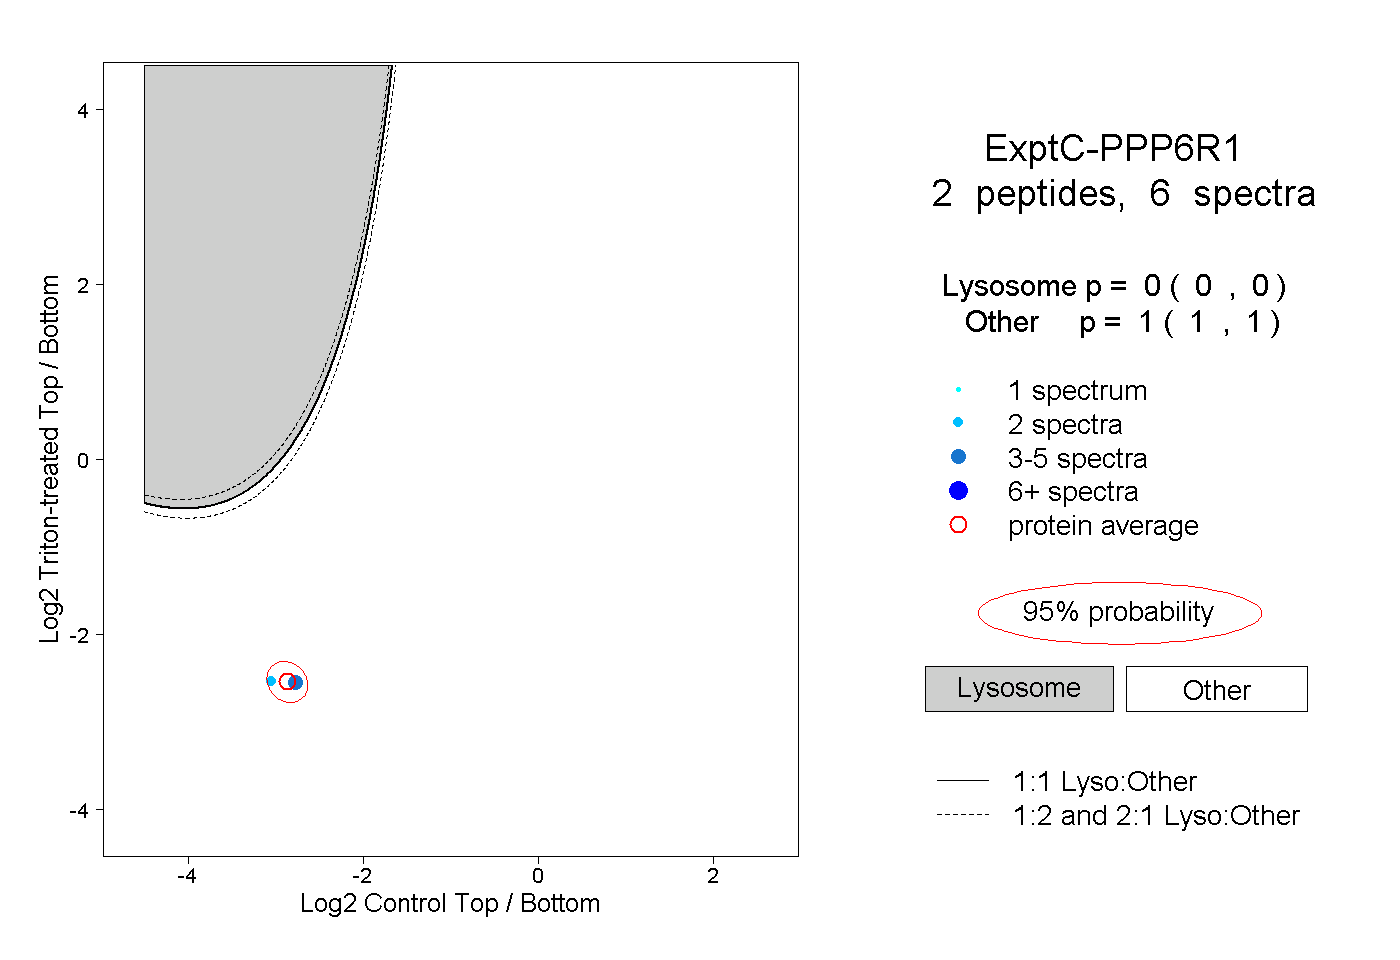
| | | Plot |
|
Lyso |
|
|
|
|
|
|
|
Other |
| Expt C |
2
peptides |
6
spectra |
 |
|
0.000
0.000 | 0.000 |
|
|
|
|
|
|
|
1.000
1.000 | 1.000 |
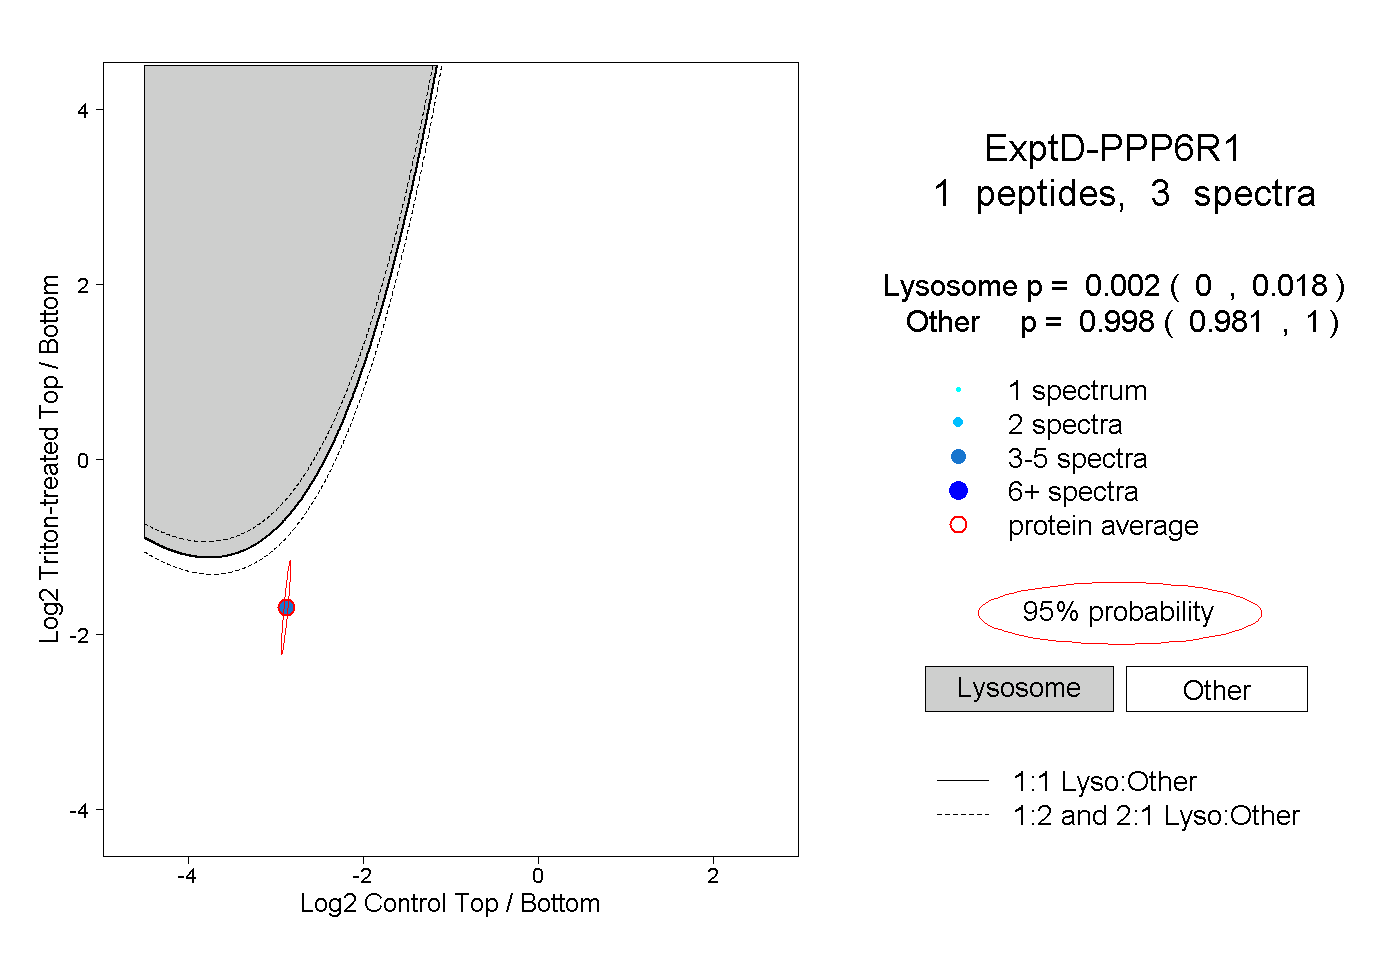
| | | Plot |
|
Lyso |
|
|
|
|
|
|
|
Other |
| Expt D |
1
peptide |
3
spectra |
 |
|
0.002
0.000 | 0.018 |
|
|
|
|
|
|
|
0.998
0.981 | 1.000 |