 6
6peptides
spectra
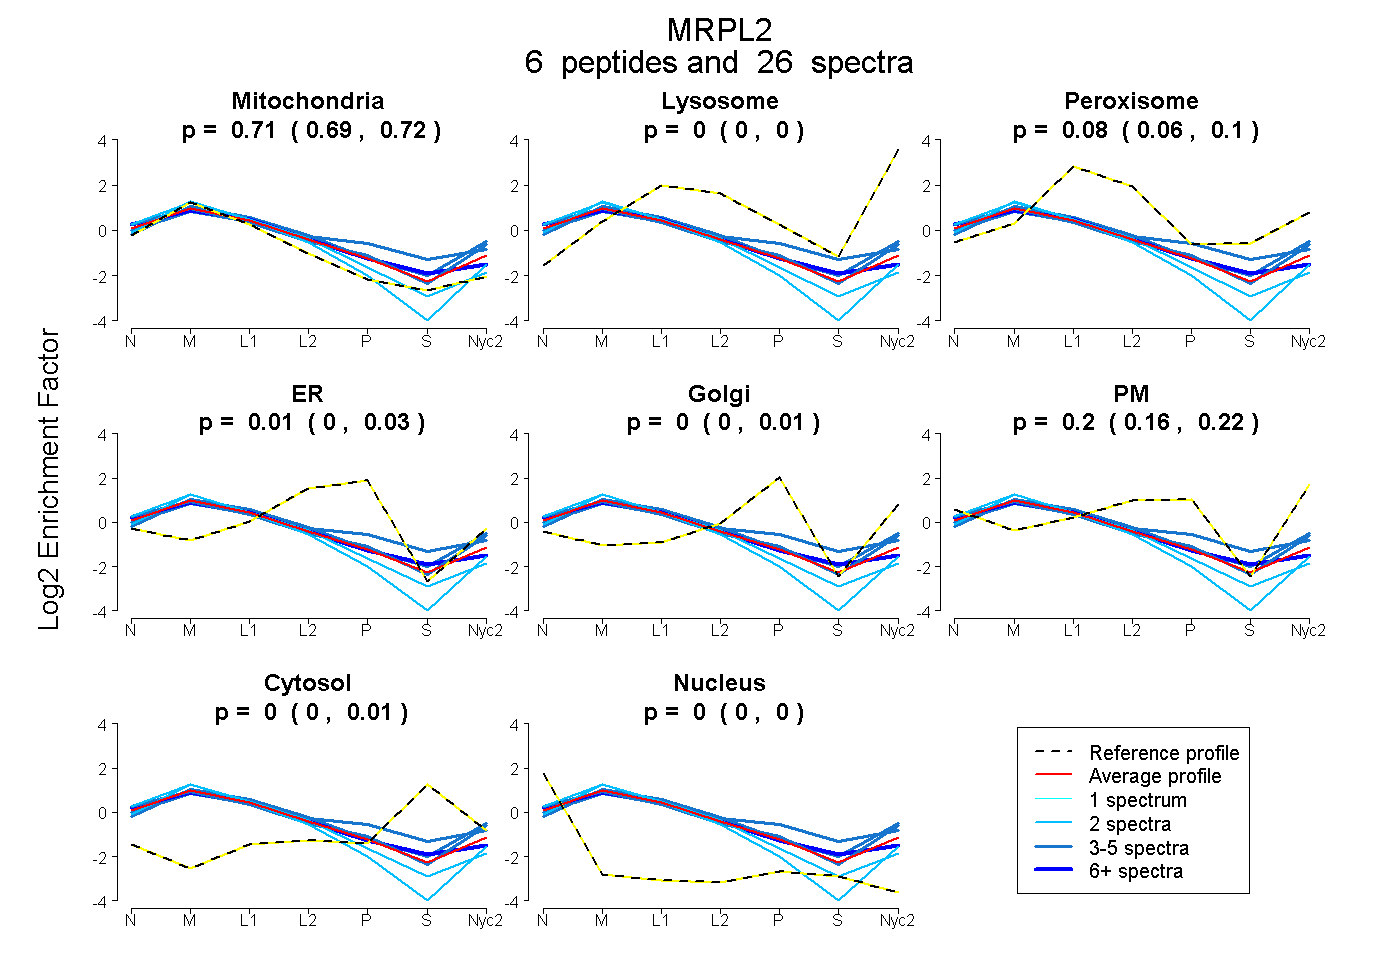
0.691 | 0.716
0.000 | 0.000
0.065 | 0.098
0.000 | 0.034
0.000 | 0.008
0.161 | 0.219
0.000 | 0.008
0.000 | 0.001
3peptides
spectra
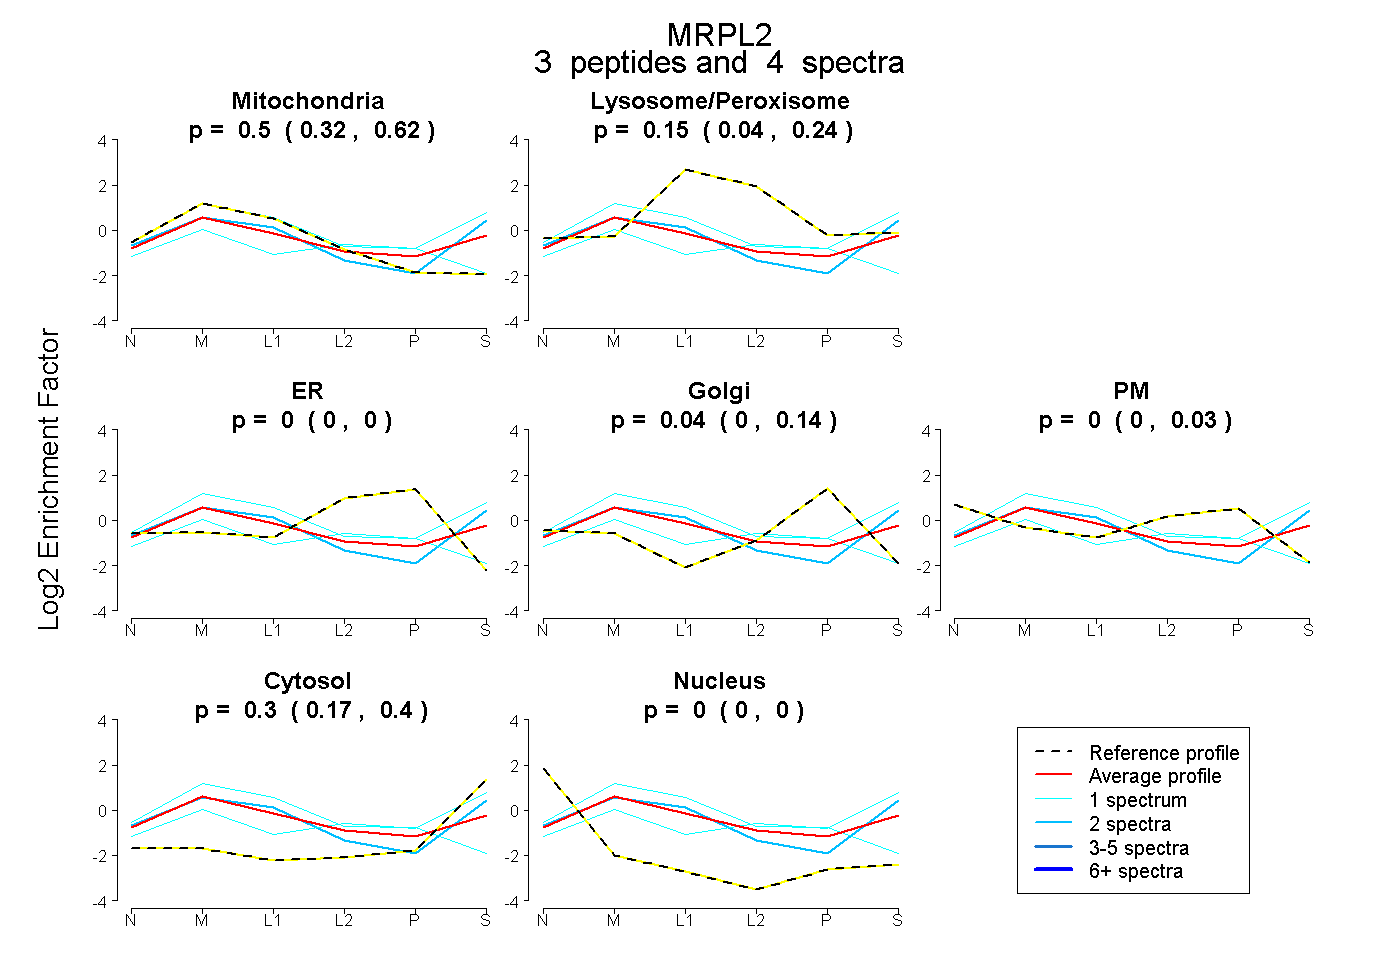
0.324 | 0.622
0.040 | 0.241
0.000 | 0.000
0.000 | 0.144
0.000 | 0.026
0.167 | 0.403
0.000 | 0.000
11peptides
spectra
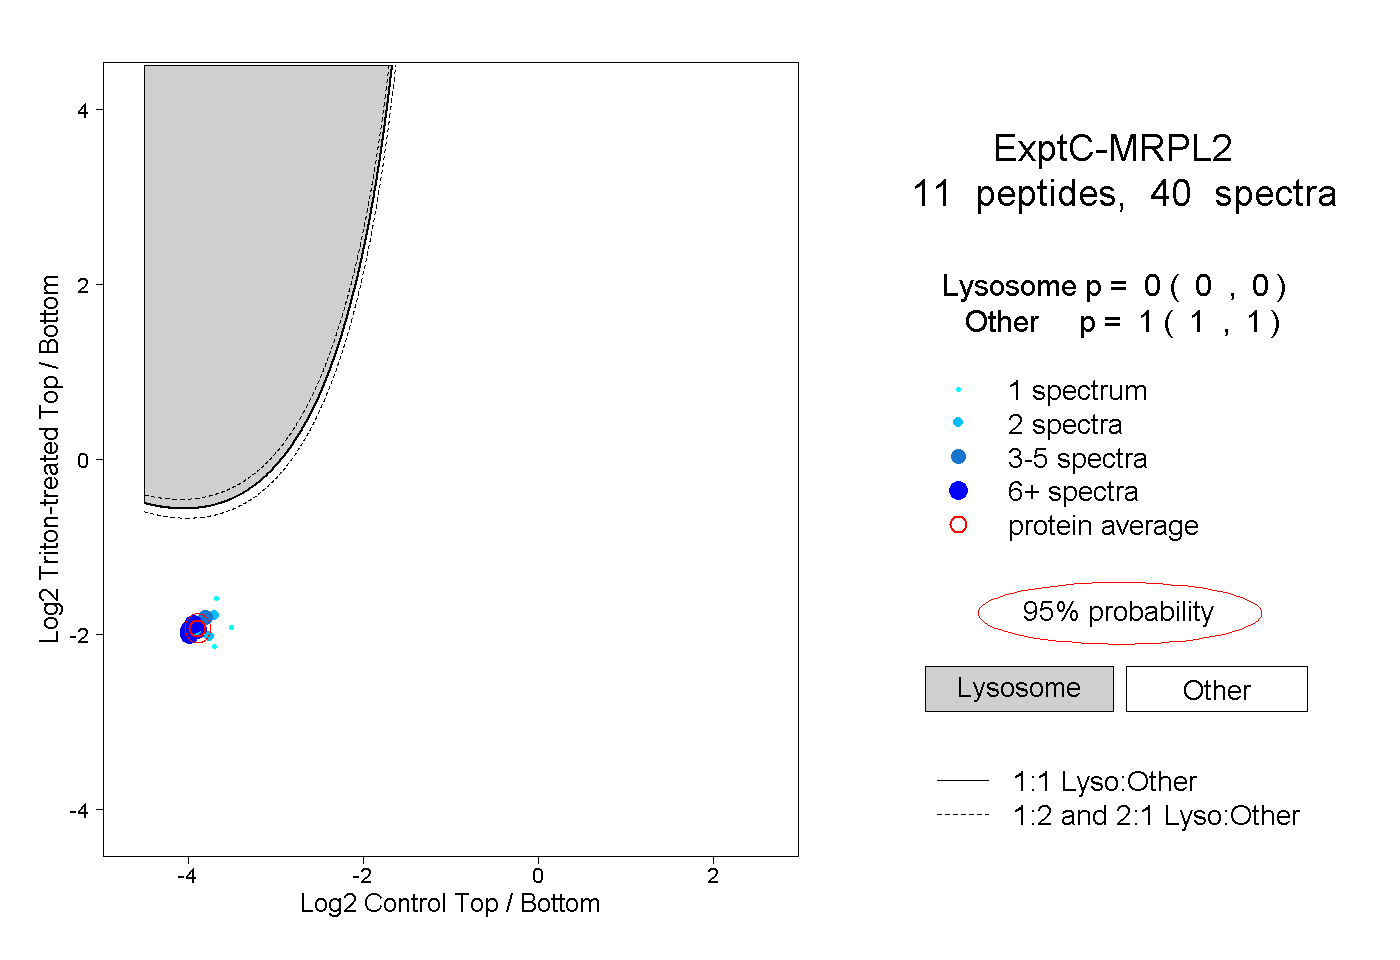
0.000 | 0.000
1.000 | 1.000
1peptide
spectrum
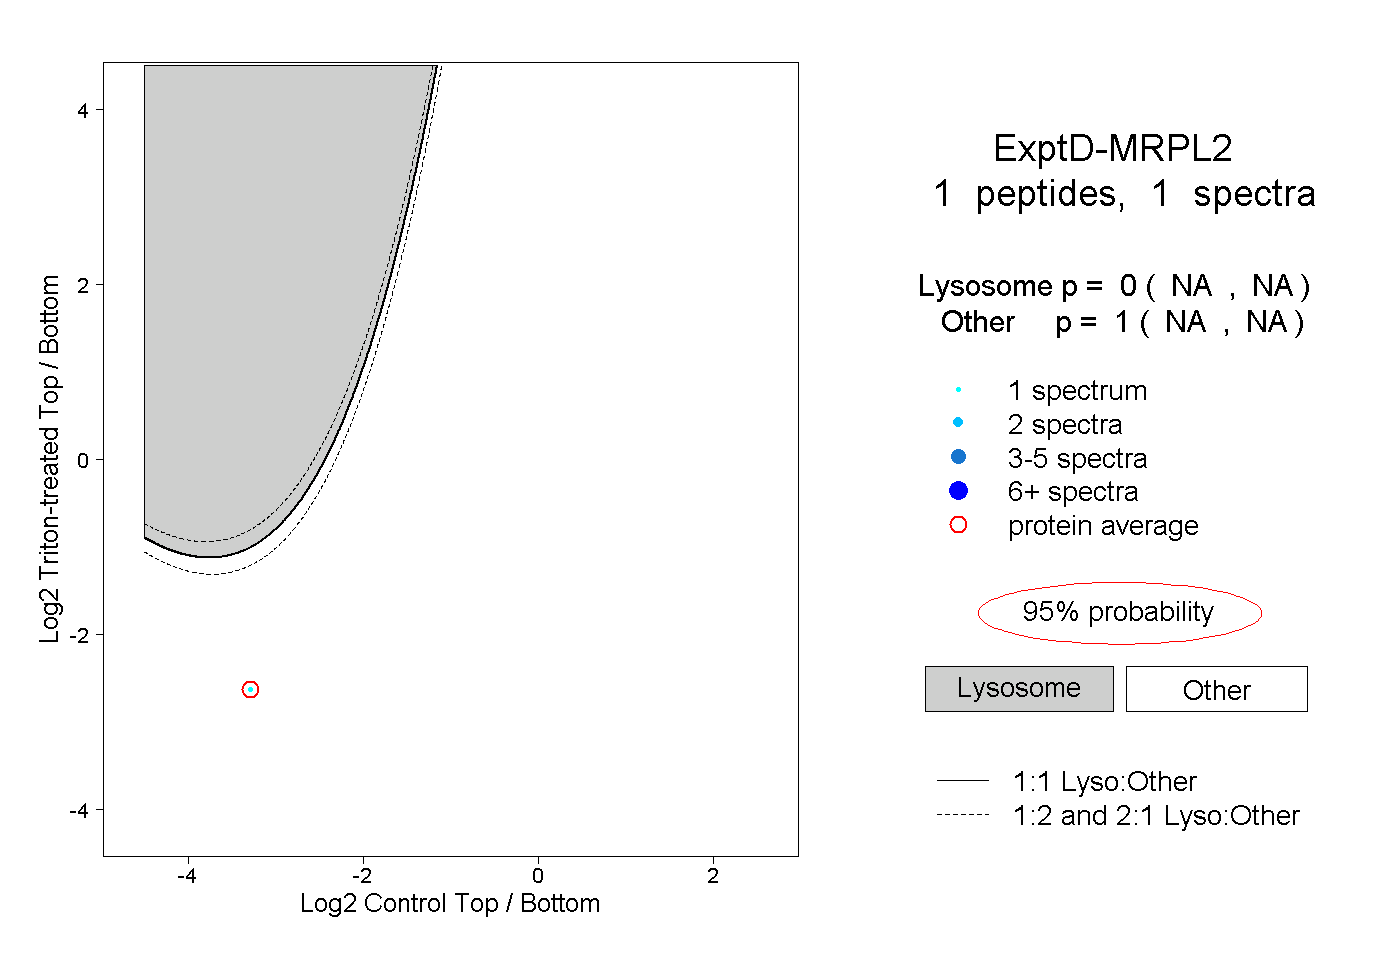
NA | NA
NA | NA