MRPL2
[ENSRNOP00000024380]
Main page
| | | Plot |
Mito |
Lyso |
|
Perox |
ER |
Golgi |
PM |
Cytosol |
Nucleus |
|
| Expt A |
 6
6
peptides |
26
spectra |
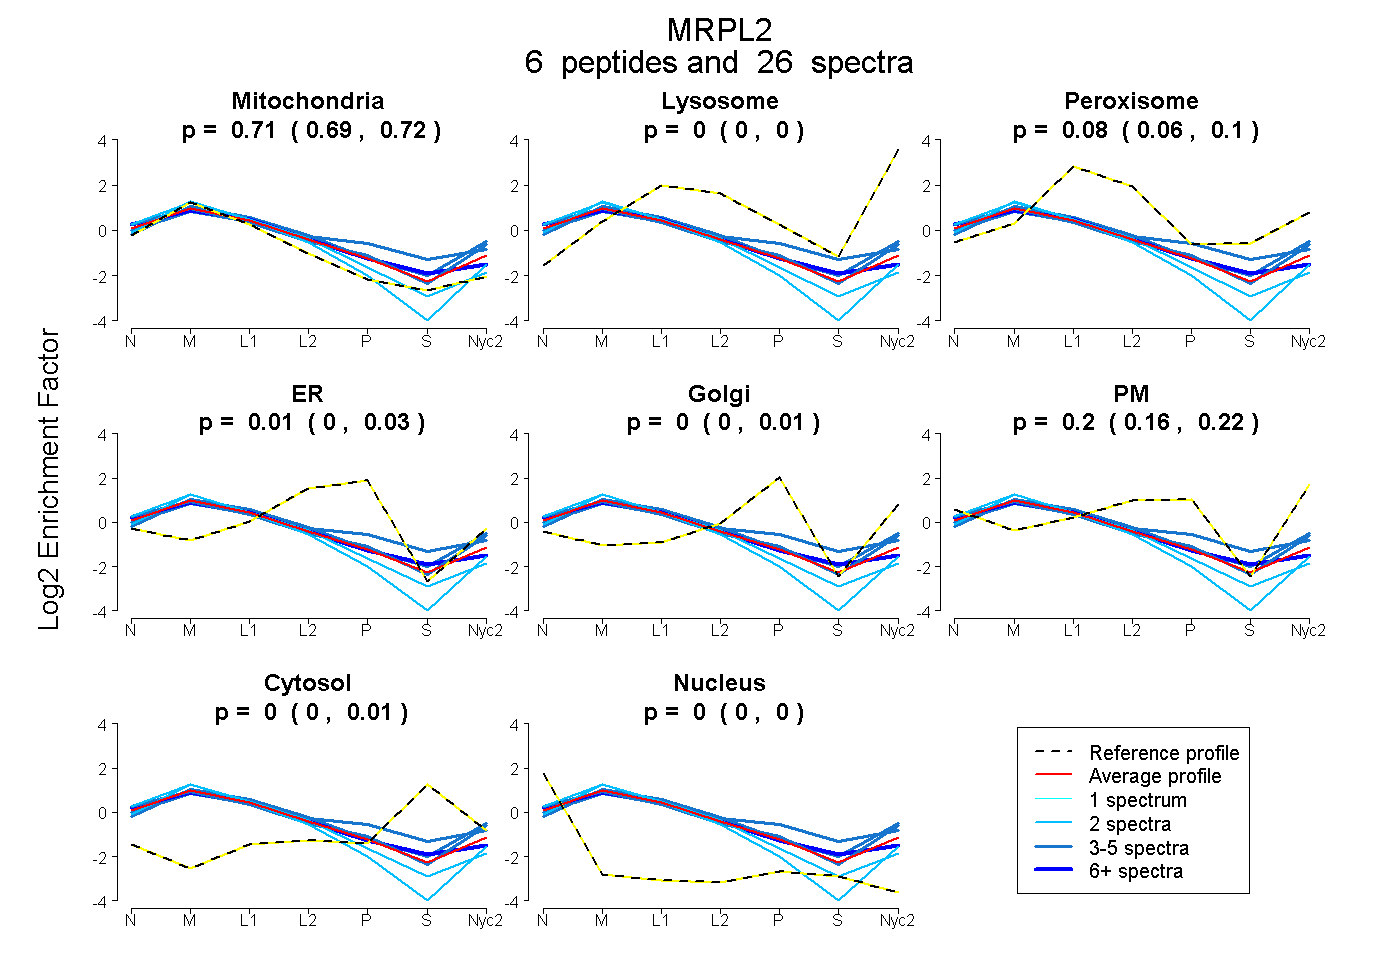 |
0.707
0.691 | 0.716 |
0.000
0.000 | 0.000 |
|
0.083
0.065 | 0.098 |
0.011
0.000 | 0.034 |
0.000
0.000 | 0.008 |
0.198
0.161 | 0.219 |
0.000
0.000 | 0.008 |
0.000
0.000 | 0.001 |
|
| | | Plot |
Mito |
|
Lyso or Perox |
|
ER |
Golgi |
PM |
Cytosol |
Nucleus |
|
| Expt B |
3
peptides |
4
spectra |
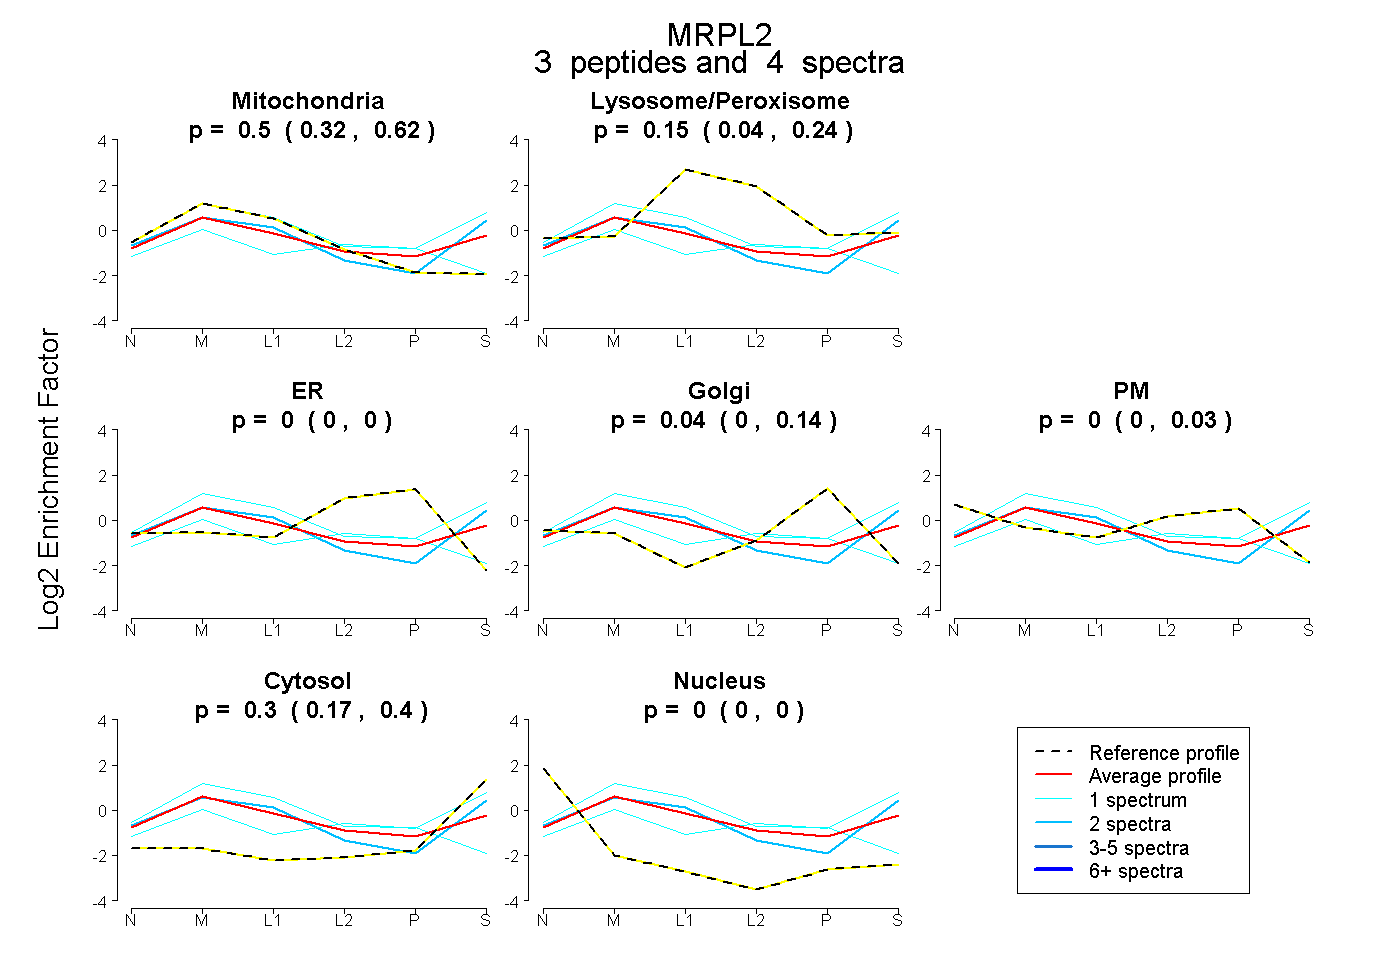 |
0.501
0.324 | 0.622 |
|
0.152
0.040 | 0.241 |
|
0.000
0.000 | 0.000 |
0.045
0.000 | 0.144 |
0.000
0.000 | 0.026 |
0.302
0.167 | 0.403 |
0.000
0.000 | 0.000 |
|
| 2 spectra, AAGTCGVLLR |
0.493 |
|
0.121 |
|
0.000 |
0.000 |
0.000 |
0.386 |
0.000 |
|
| 1 spectrum, SADIALVAGGSR |
0.120 |
|
0.232 |
|
0.000 |
0.125 |
0.000 |
0.523 |
0.000 |
|
| 1 spectrum, VHGIGGGHK |
0.759 |
|
0.069 |
|
0.067 |
0.104 |
0.000 |
0.000 |
0.000 |
|
| | | Plot |
|
Lyso |
|
|
|
|
|
|
|
Other |
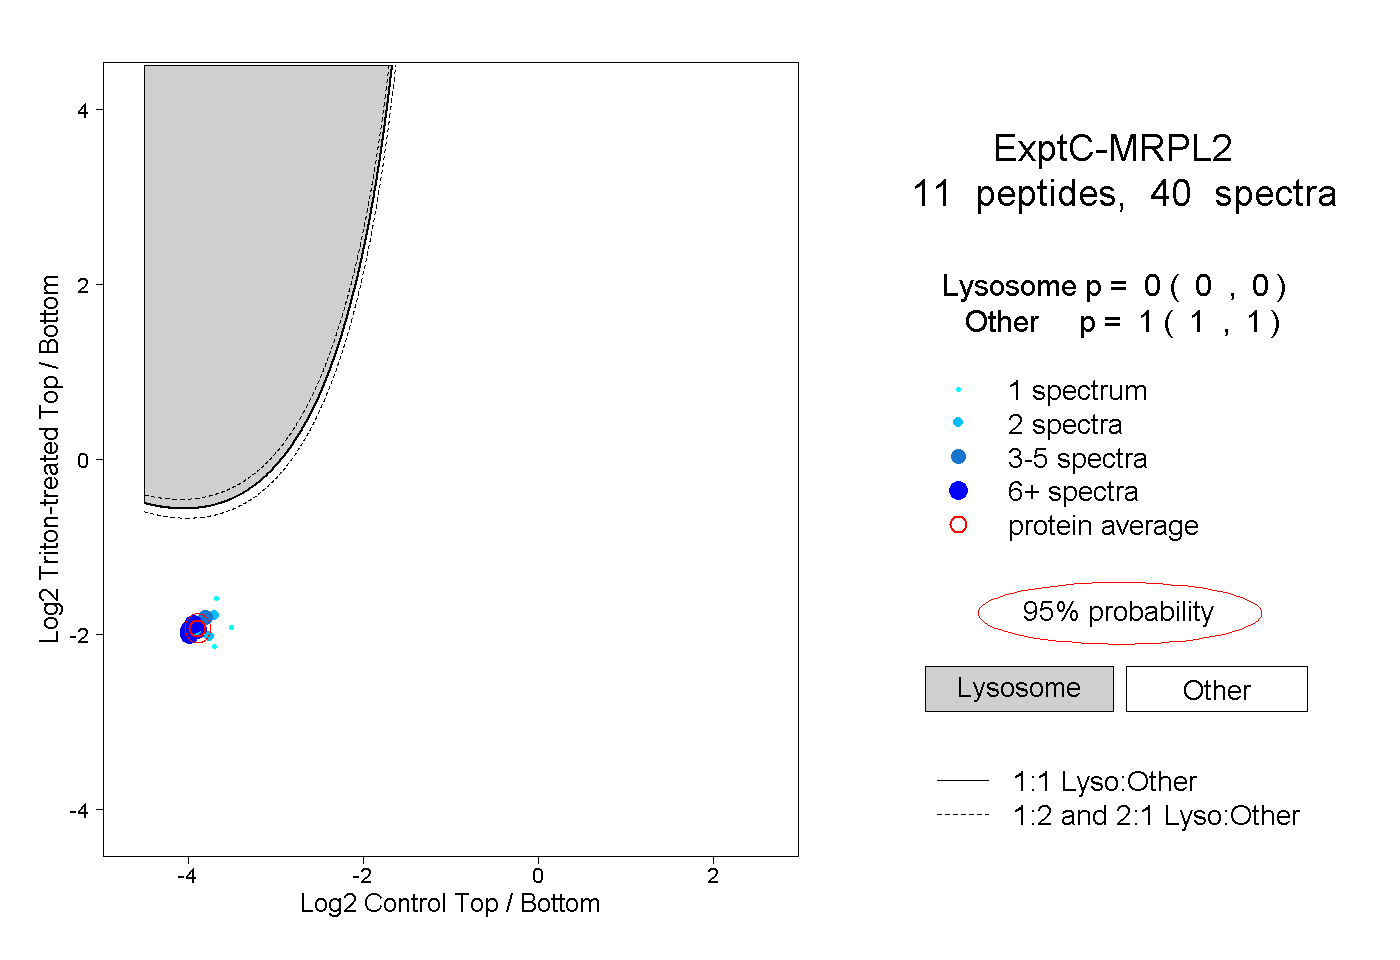
| Expt C |
11
peptides |
40
spectra |
 |
|
0.000
0.000 | 0.000 |
|
|
|
|
|
|
|
1.000
1.000 | 1.000 |
| | | Plot |
|
Lyso |
|
|
|
|
|
|
|
Other |
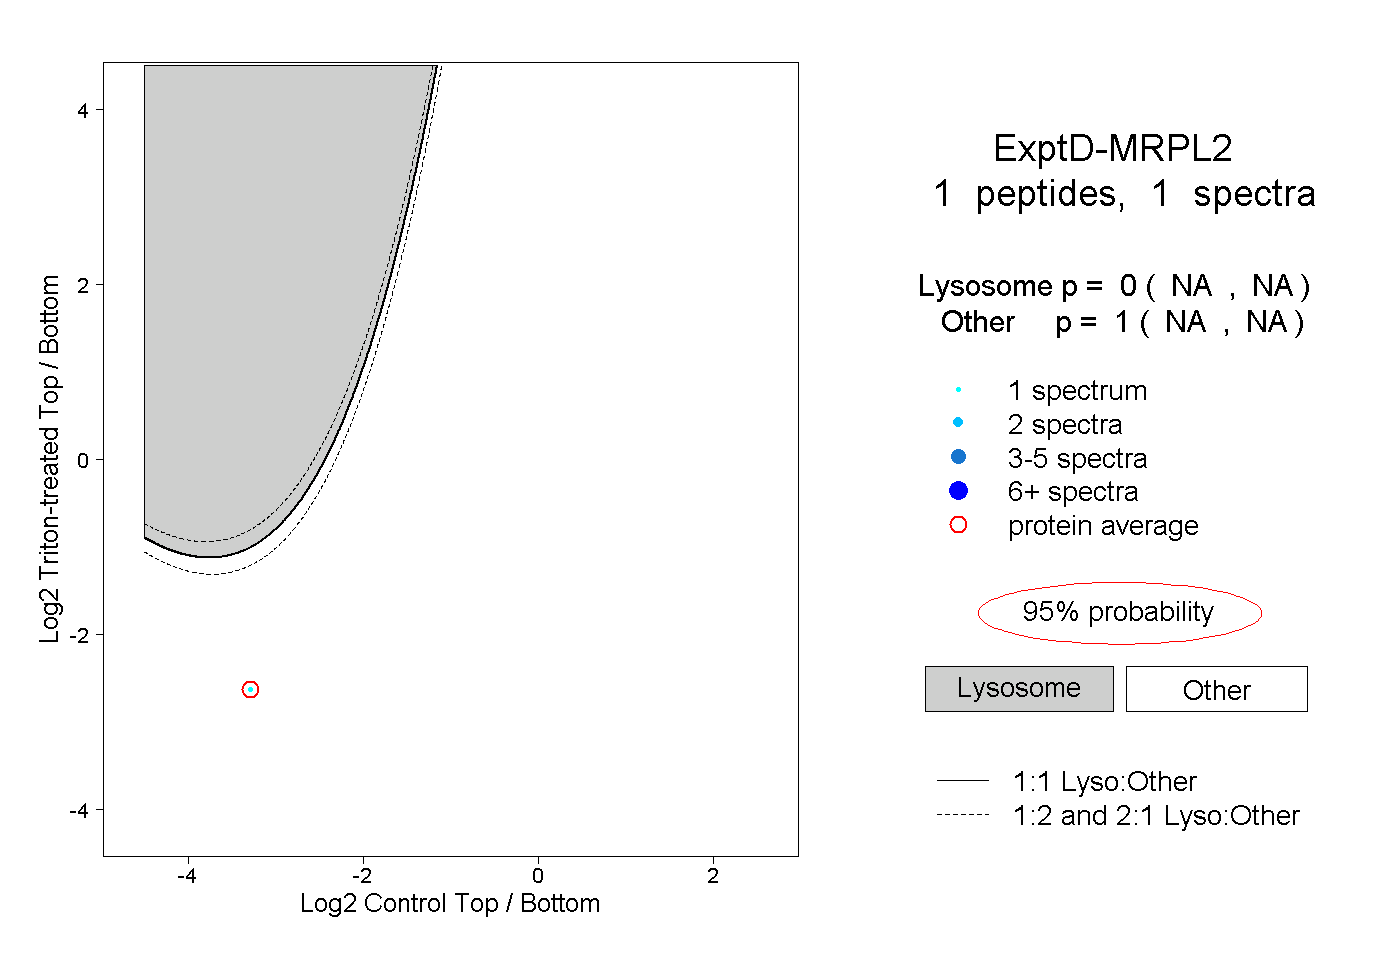
| Expt D |
1
peptide |
1
spectrum |
 |
|
0.000
NA | NA |
|
|
|
|
|
|
|
1.000
NA | NA |