 18
18peptides
spectra
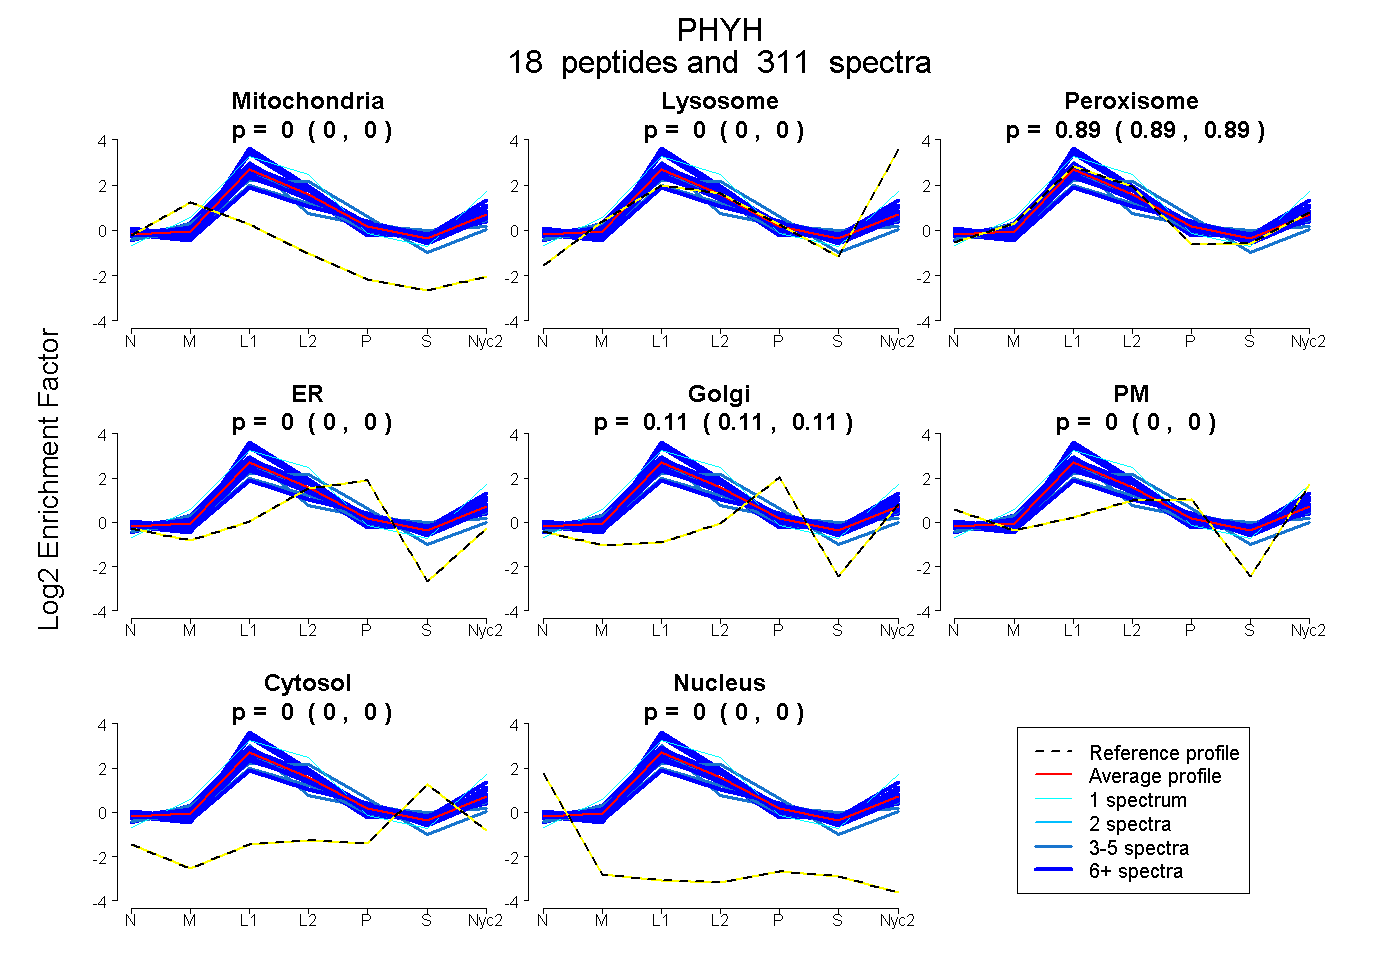
0.000 | 0.000
0.000 | 0.000
0.889 | 0.893
0.000 | 0.001
0.105 | 0.109
0.000 | 0.000
0.000 | 0.002
0.000 | 0.000
16peptides
spectra
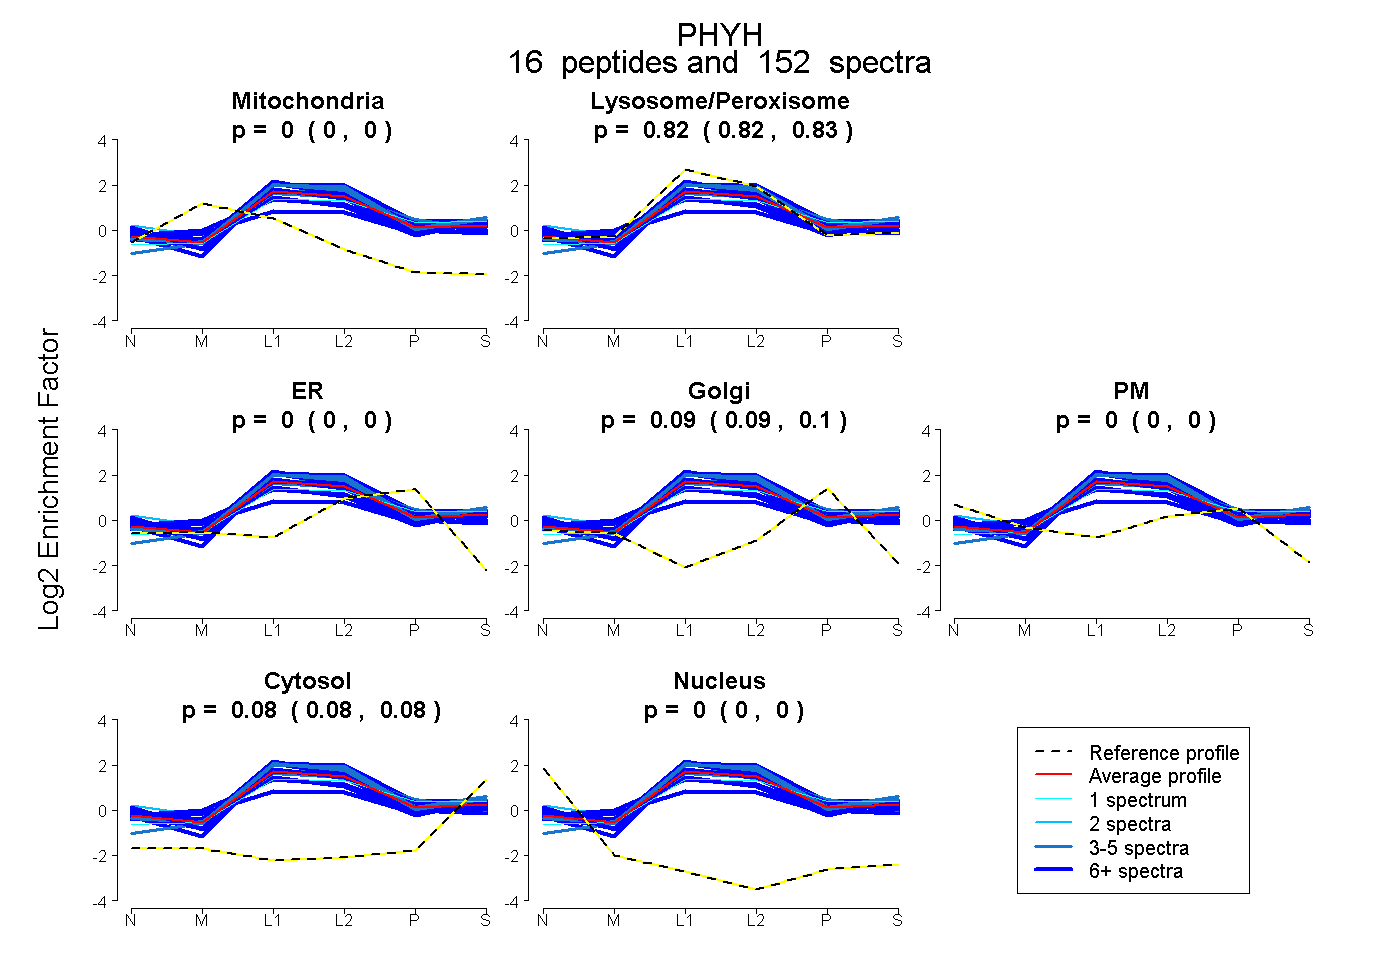
0.000 | 0.000
0.821 | 0.825
0.000 | 0.000
0.091 | 0.096
0.000 | 0.000
0.081 | 0.085
0.000 | 0.000
18peptides
spectra
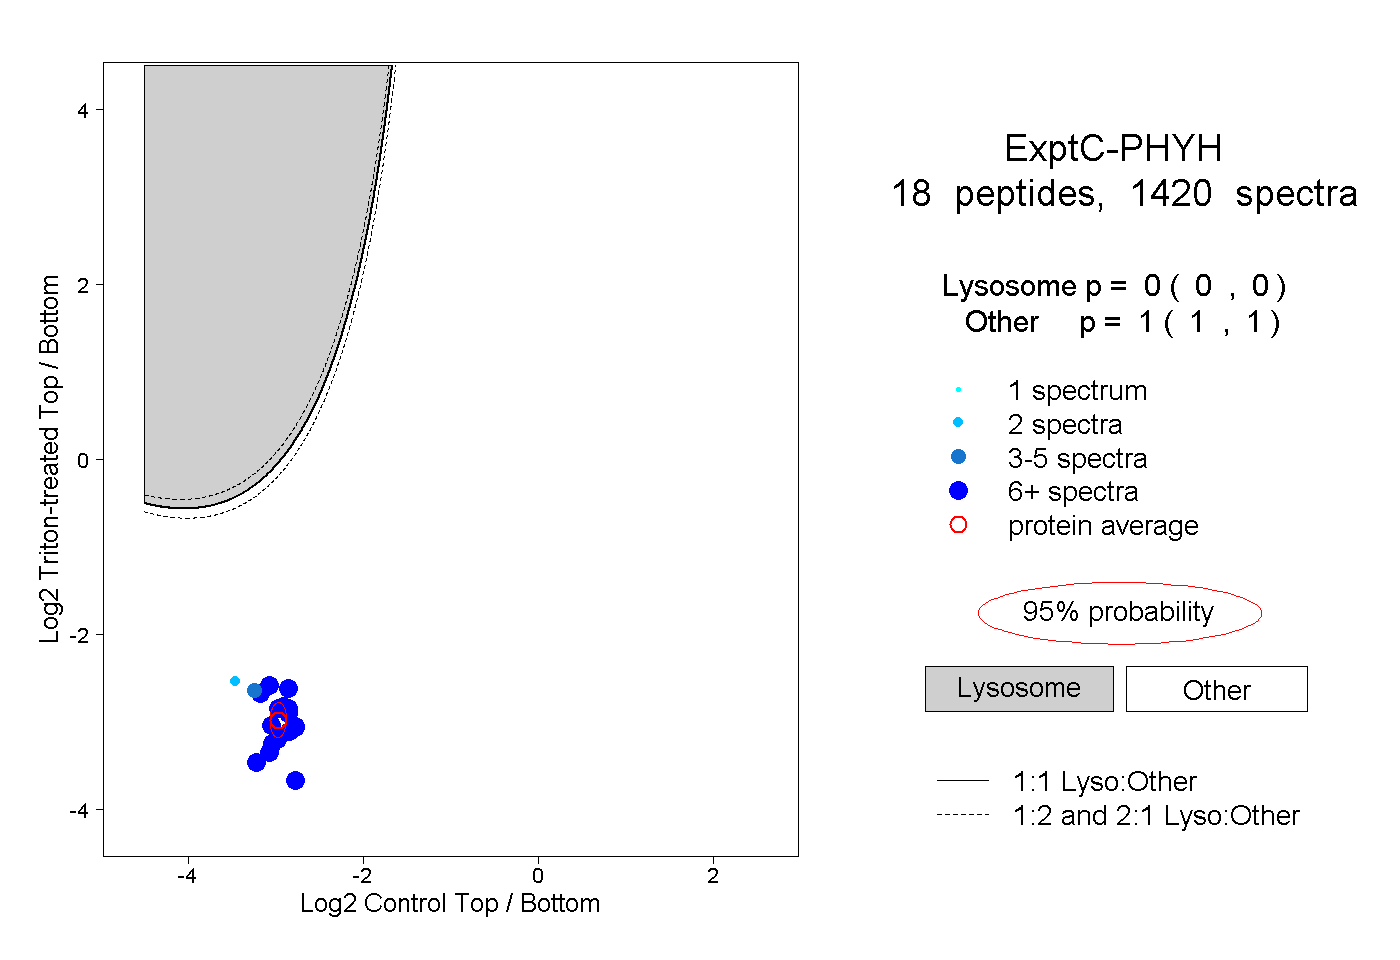
0.000 | 0.000
1.000 | 1.000
13peptides
spectra
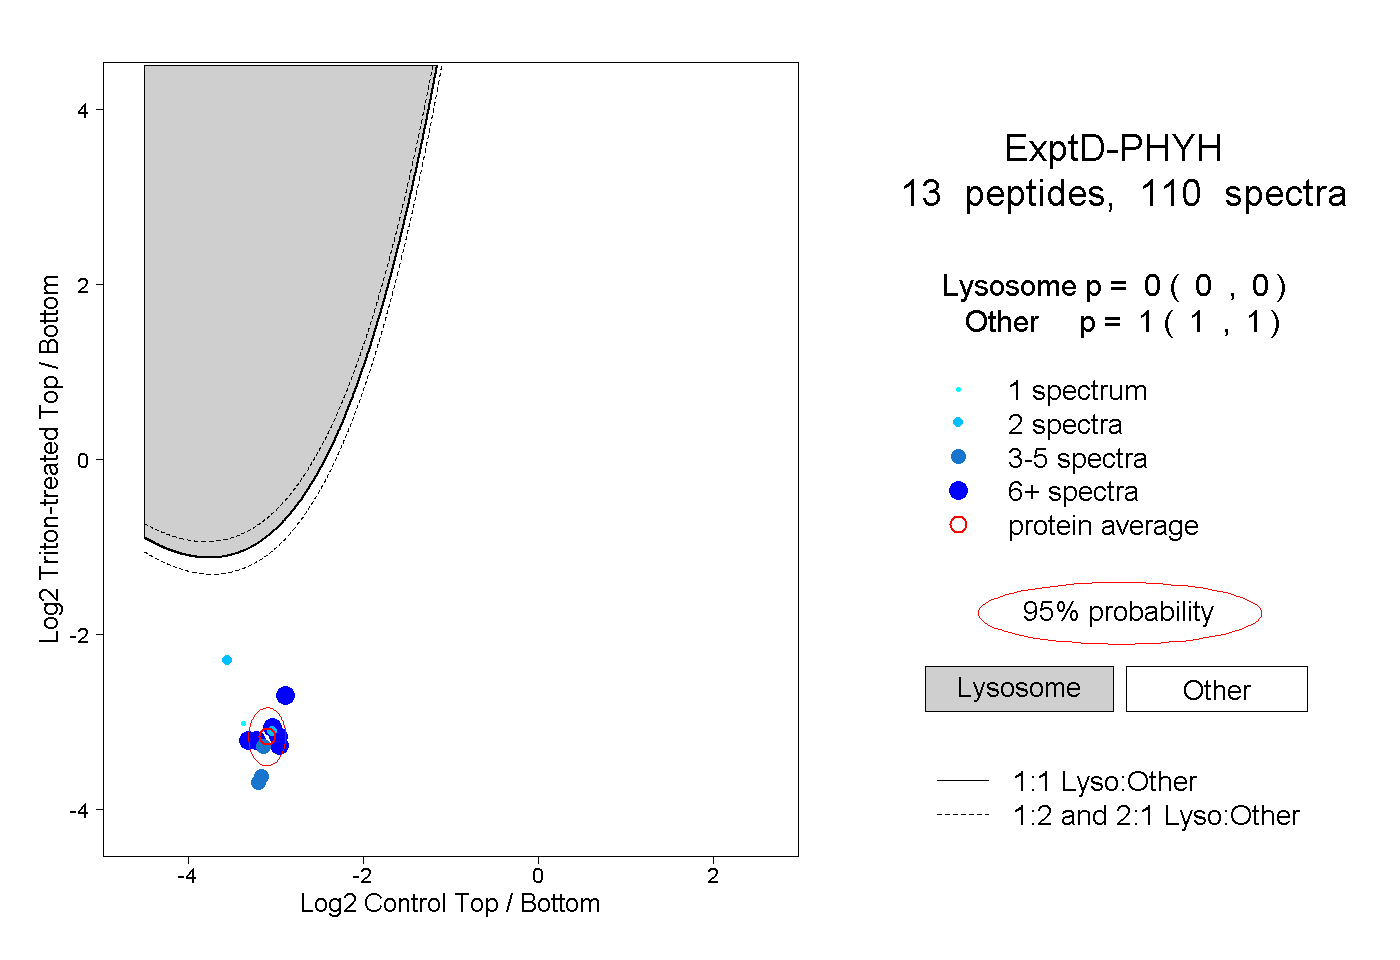
0.000 | 0.000
1.000 | 1.000